Author: sHq_LoGiNz
Recently, United Way of Southeast Louisiana celebrated a year of community impact at its annual meeting, highlighting partnerships that strengthened regional nonprofits and expanded support for families across the Gulf South.
Drew Marsh, Entergy chair and CEO, delivered the meeting’s featured address, marking the conclusion of his service as campaign cabinet chair for our company’s employee giving effort. Each year, Entergy employees actively engage in the annual giving campaign to support their local United Way initiatives that enhance education, promote financial stability and improve health in the communities we serve.
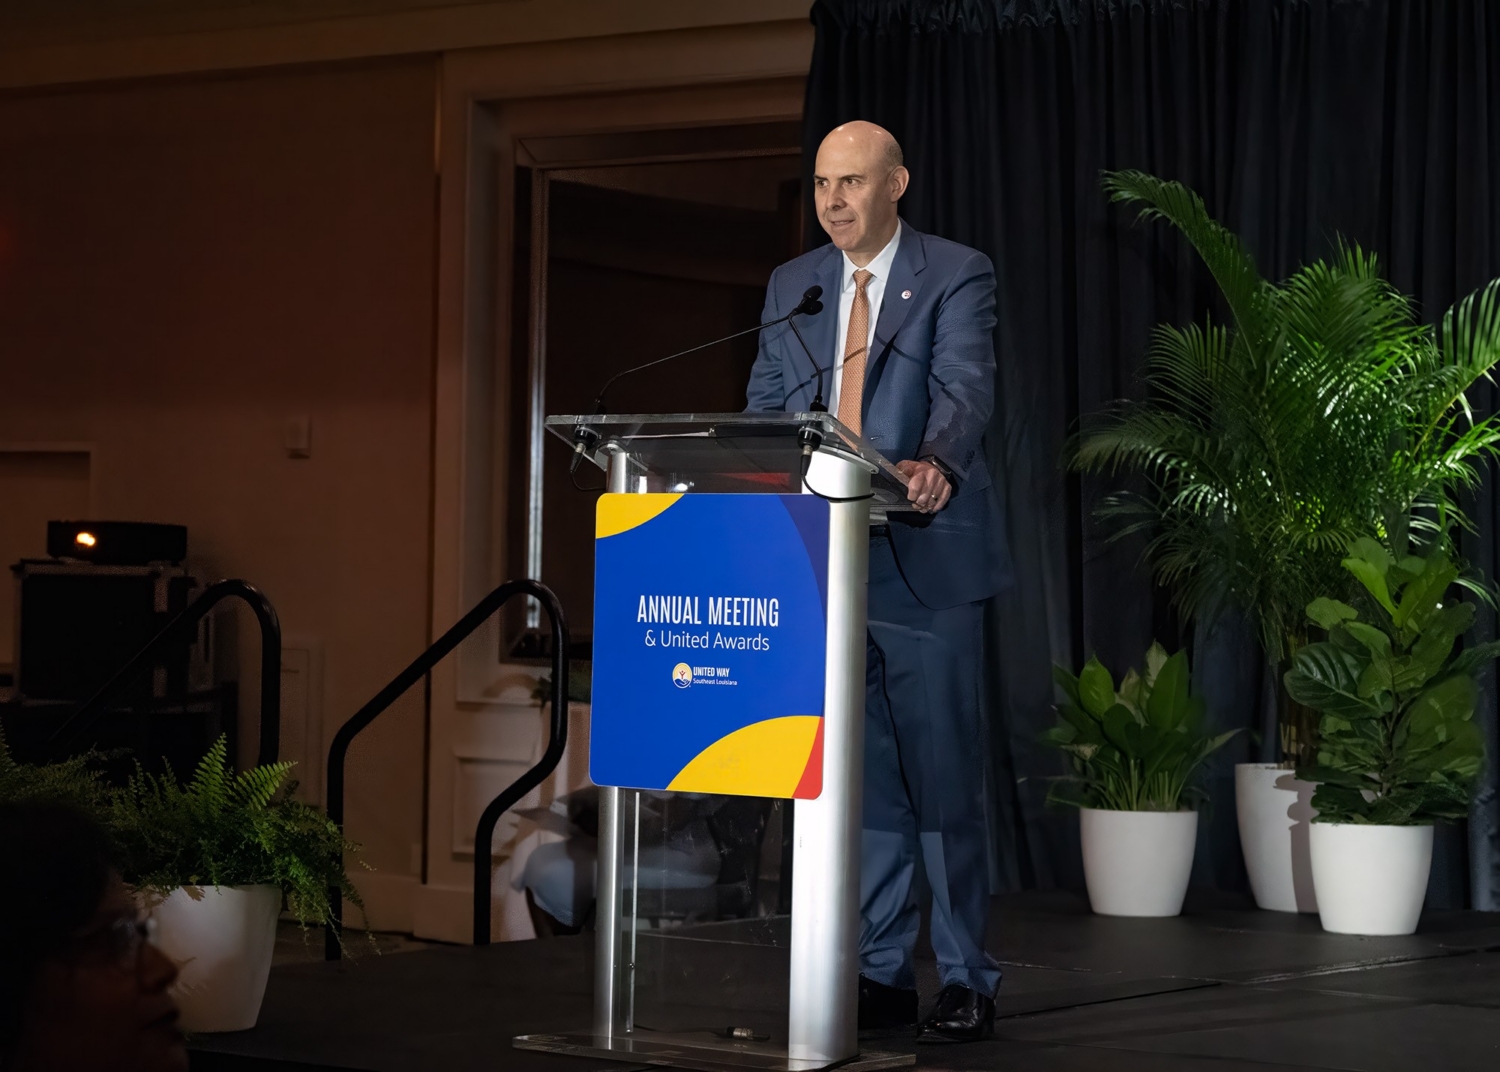
For the local campaign, which focuses on supporting residents of Jefferson, Orleans, Plaquemines, St. Bernard, St. Tammany, Tangipahoa, and Washington parishes, Marsh led a team of local business leaders to encourage giving throughout Southeast Louisiana. Under his leadership, the campaign raised more than $7.7 million, surpassing their goal by $262,209.
“Here in Southeast Louisiana, it doesn’t take much — a storm, a medical bill, a lost hour of work, and yes sometimes a high electric bill from a cold winter or hot summer, or even high natural gas prices — for a family to slip into crisis,” Marsh said. “Our customers — the very people we serve — and our communities and even sometimes our employees turn to the United Way for support. And that’s why Entergy’s decades-long partnership with United Way means so much to me. Because United Way steps into those gaps. They don’t wait for crises — they work to prevent them.”
United Way leaders also honored Michelle Delery, Entergy vice president of internal and external communications, with the Edward J. Krause Volunteer of the Year Award. The award recognizes an individual who goes above and beyond to volunteer, advocate or donate in support of United Way’s mission to eradicate poverty. Delery, who serves on the United Way board of trustees, was recognized for her dedication to advancing the United Way initiatives and her longstanding commitment to community service.
Under Marsh’s leadership, Entergy employees continued their strong tradition of supporting United Way programs focused on education, financial stability and essential services for vulnerable households. Delery along with Patty Riddlebarger, vice president, corporate social responsibility also accepted the United Way Top Workplace giving campaign award on behalf of the company. United Way leaders praised Entergy for its continued partnership, calling the company a key contributor to long‑term community resiliency.
Learn more about Entergy’s commitment to serving its communities.
View original content here.
Originally published on Aflac Newsroom
COLUMBUS, Ga., June 29, 2026 /3BL/ – Aflac, a pioneer and leader in cancer insurance for seven decades, today announced the launch of Fit Checks, an innovative new awareness campaign developed with fashion designer Rachel Zoe, transforming a familiar pattern into an interactive pathway to understanding cancer risk and educating on the importance of screenings.
At the center of the campaign is a first-of-its-kind garment designed by Rachel Zoe that features a custom checkered pattern with a QR code seamlessly integrated into the design, turning everyday fashion into a health activation tool. The limited-edition garment, when scanned, connects consumers directly to CheckForCancerNow.com, a new website dedicated to increasing awareness of the value of cancer screenings.
“For too many people, cancer screenings remain something they’ll get around to when it is convenient,” said Virgil Miller, president, Aflac Incorporated and Aflac U.S. “Fit Checks is designed to change that by driving awareness from an unexpected place: the clothes we wear. By partnering with well-known designer and media star Rachel Zoe, we’re creating a new way to meet people in unexpected places with a powerful message, spark action and make conversations about early detection a part of everyday life.”
The campaign comes at a time when too many Americans continue to delay preventive care. According to the 2025 Aflac Wellness Matters Survey, roughly 3 in 5 Americans (59%) admit to avoiding important health screenings, while 9 in 10 Americans (94%) say they have delayed a checkup or recommended health screening. These findings reinforce the urgent need to make early detection more approachable, accessible and actionable.
“Fashion has always been a way for people to express themselves, but it can also be a powerful way to break through in culture and start important conversations,” said Rachel Zoe. “What drew me to this campaign was the opportunity to create something that feels stylish and meaningful at the same time. If fashion can inspire people to check for cancer, we are making fashion not only wearable but purposeful as well.”
To kick off Aflac’s partnership with Zoe, the company has released, on social media, a brief video previewing the anticipated campaign which launches later this year, showing how her newly designed garment will signal a broader plea to encourage potentially lifesaving cancer screenings. Consumers can take the first step toward understanding their cancer risk by visiting CheckForCancerNow.com to learn more about early detection and why it is so important to check for cancer.
“Fashion occupies a unique place in culture, creating opportunities to reach people beyond traditional settings. Through Fit Checks, Aflac, a leading provider of cancer insurance in the United States and Japan, is leveraging that cultural relevance to make cancer awareness more visible, and to drive action,” Miller said.
Fit Checks is part of Aflac’s broader Check for Cancer movement, which aims to associate the checkered patterns people see every day with a movement to increase cancer screenings. The goal is to increase screenings in the U.S. by 10% over the next 10 years.
To learn more, visit www.CheckForCancerNow.com.
FAQs about the Check for Cancer initiative and Fit Checks campaign
-
What does Check for Cancer mean?
Check for Cancer is a national movement created by Aflac to help increase cancer screenings in the U.S. by 10% over 10 years. By transforming the checkered pattern into a powerful call to action, the movement helps encourage people to prioritize cancer screenings, because early detection can save lives.
At its core, Check for Cancer is about making cancer screenings a more visible and urgent priority, helping people learn about their risks, understand recommended screenings and take action earlier.
-
Why is early detection so important?
Cancer can affect anyone. One in three people will be diagnosed with cancer in their lifetime, but when found early, many cancers have five-year survival rates above 90%.
That is why Aflac is encouraging people to learn about their risks and prioritize recommended screenings. The earlier cancer is found, the more options people may have and the better their chances of a positive outcome.
-
What is Fit Checks?
Fit Checks is a Check for Cancer awareness campaign designed to help make cancer screening more urgent, accessible and hard to ignore. By leveraging fashion as a powerful vehicle to turn awareness into action, Fit Checks transforms the checkered pattern into a purposeful prompt to check for cancer. In partnership with celebrity fashion designer Rachel Zoe, Aflac created a first-of-its-kind garment with a QR code embedded in the print, making it easy for people to learn about their cancer risk on the spot.
ABOUT AFLAC INCORPORATED
Aflac Incorporated (NYSE: AFL), a Fortune 500 company, has helped provide financial protection and peace of mind for more than seven decades to millions of policyholders and customers through its subsidiaries in the U.S. and Japan. In the U.S., Aflac is the No. 1 provider of supplemental health insurance products.1 In Japan, Aflac Life Insurance Japan is the leading provider of cancer and medical insurance in terms of policies in force.2 The company takes pride in being there for its policyholders when they need us most, as well as being included in the World’s Most Ethical Companies by Ethisphere for 20 consecutive years (2026) and Fortune’s World’s Most Admired Companies for 25 years (2026). In addition, the company became a signatory of the Principles for Responsible Investment (PRI) in 2021. To find out how to get help with expenses health insurance doesn’t cover, get to know us at aflac.com or aflac.com/español. Investors may learn more about Aflac Incorporated and its commitment to corporate social responsibility and sustainability at investors.aflac.com under “Sustainability.”
1 LIMRA 2025 U.S. Supplemental Health Insurance Total Market Report
2 As of March 31, 2025, Aflac estimates based on company data
Media contact: Darcy Brito, 706-505-9762 or dbrito@aflac.com
Analyst and investor contact: David A. Young, 706-596-3264, 800-235-2667 or dyoung@aflac.com
Aflac WWHQ | 1932 Wynnton Road | Columbus, GA 31999
Aflac New York | 22 Corporate Woods Boulevard, Suite 2 | Albany, New York 12211
Continental American Insurance Company | Columbia, SC
# # #
LINCOLN, Neb., June 29, 2026 /3BL/ – The Arbor Day Foundation welcomes the release of the Science Based Targets Initiative’s (SBTi) finalized Corporate Net-Zero Standard 2.0, the leading guidance for corporate decarbonization commitments worldwide.
The updated standard introduces an “Ongoing Emissions Responsibility” framework spanning three phases through 2050 and beyond. It also allows companies to apply an internal carbon price towards the purchase of carbon credits for emission offsetting, as well as to support climate adaptation and disaster recovery projects.
“This updated standard is a meaningful step forward for corporate climate accountability, and it opens important new doors for nature-based solutions like reforestation,” said Dr. Christopher Kibler, Senior Scientist at the Arbor Day Foundation. “For corporations, the new flexibility to direct internal carbon pricing toward climate adaptation and disaster recovery projects means that tree planting can now play a more central role in a company’s broader climate strategy. Forests are one of our most powerful tools for carbon sequestration, biodiversity, and community resilience, and standards like this one help ensure that corporate investment flows toward projects that deliver real, lasting impact. We encourage companies not to wait for the mandatory phases of this framework to begin. The need for climate action, and the opportunity to make a difference, is here right now.”
The Arbor Day Foundation is a global nonprofit with more than five decades of tree planting experience and has helped hundreds of businesses achieve their sustainability goals through trees. In the coming weeks, the Foundation will continue to reflect on SBTi’s Corporate Net-Zero Standard Version 2.0 and what it could mean for the Foundation’s corporate partners, carbon markets, and trees.
Visit arborday.org to learn more about the importance of corporate engagement in tree planting.
About the Arbor Day Foundation
The Arbor Day Foundation is a global nonprofit inspiring people to plant, nurture, and celebrate trees. They foster a growing community of more than 1 million leaders, innovators, planters, and supporters united by their bold belief that a more hopeful future can be shaped through the power of trees. For more than 50 years, they’ve answered critical need with action, planting more than half a billion trees alongside their partners.
And this is only the beginning.
The Arbor Day Foundation is a 501(c)(3) nonprofit pursuing a future where all life flourishes through the power of trees. Learn more at arborday.org.
###
by Robin John, CEO of Eventide Funds
For years, I’ve been fascinated by (and immensely grateful for) the ways improved biotechnology, new therapies, and groundbreaking medical research can radically improve people’s lives. All kinds of medical crises are now remedied by routine procedures and ordinary medications. And even with incurable diseases, which still ravage the body, we are now able to manage many of them and provide a real quality of life. Science is astounding.
We do live in a remarkable age of medical research, and over the years, I’ve discovered profound joy from investing in biotechnology and other healthcare companies through Eventide, the investment company where I serve as CEO. A few partners and I founded Eventide because we were unfulfilled by a career path focused solely on security and upward mobility. We wanted to figure out how we could use our experience and knowledge to make the world better. So, for 18 years, we’ve invested in companies we believe are well-managed, ethical, and will make healthy profits—but (and this part is crucial) also in companies that are creating products and services that do good for the world. And I can’t imagine a company doing anything better for the world than saving lives. The healthcare industry faces many well-known struggles that need to be addressed, but we can’t let this flaw drown out the fact that so many good companies are saving and improving lives every day. This article looks at how and more.
Read Robin’s full article with hope filled stories and how their portfolios make a difference, all here- https://greenmoney.com/investing-healing-how-our-choices-can-help-to-mend-the-world
====
FedEx is known for delivering packages around the world—but this month, the company delivered something far more unique. Through its FedEx Cares Delivering for Good initiative, FedEx helped transport Walnut, a four-year-old harbor seal, from the Los Angeles Zoo to his new home at Blank Park Zoo in Des Moines, Iowa. The move was part of a collaborative effort involving the Los Angeles Zoo, SeaWorld San Diego, and Blank Park Zoo, all working together through the Association of Zoos and Aquariums (AZA).
Walnut’s journey began in Los Angeles, where he boarded a FedEx aircraft and traveled through Memphis before arriving in Omaha. Throughout the trip, Blank Park Zoo animal care and veterinary staff accompanied him to ensure his safety and well-being. SeaWorld San Diego provided a specialized transport crate, highlighting the level of coordination and care required to move animals safely between accredited institutions.
When the aircraft landed in Omaha, members of the Blank Park Zoo team met the flight directly on the tarmac and transported Walnut to Des Moines. Even in an unconventional delivery, some protocols remained unchanged—FedEx delivery paperwork still required a signature. As Chief Animal Officer Jay Tetzloff noted, it’s not every day you sign for a harbor seal, a moment that underscored the unique collaboration behind the effort.
Now settled in Iowa, Walnut will complete a standard quarantine period before joining California sea lions Zoey and Meatball at the zoo’s Hub Harbor habitat. His arrival marks an exciting addition during Blank Park Zoo’s milestone anniversary year—and serves as a reminder of how FedEx’s global network can support critical, one-of-a-kind missions that go far beyond traditional shipping.
Click here to learn about FedEx Cares, our global community engagement program.
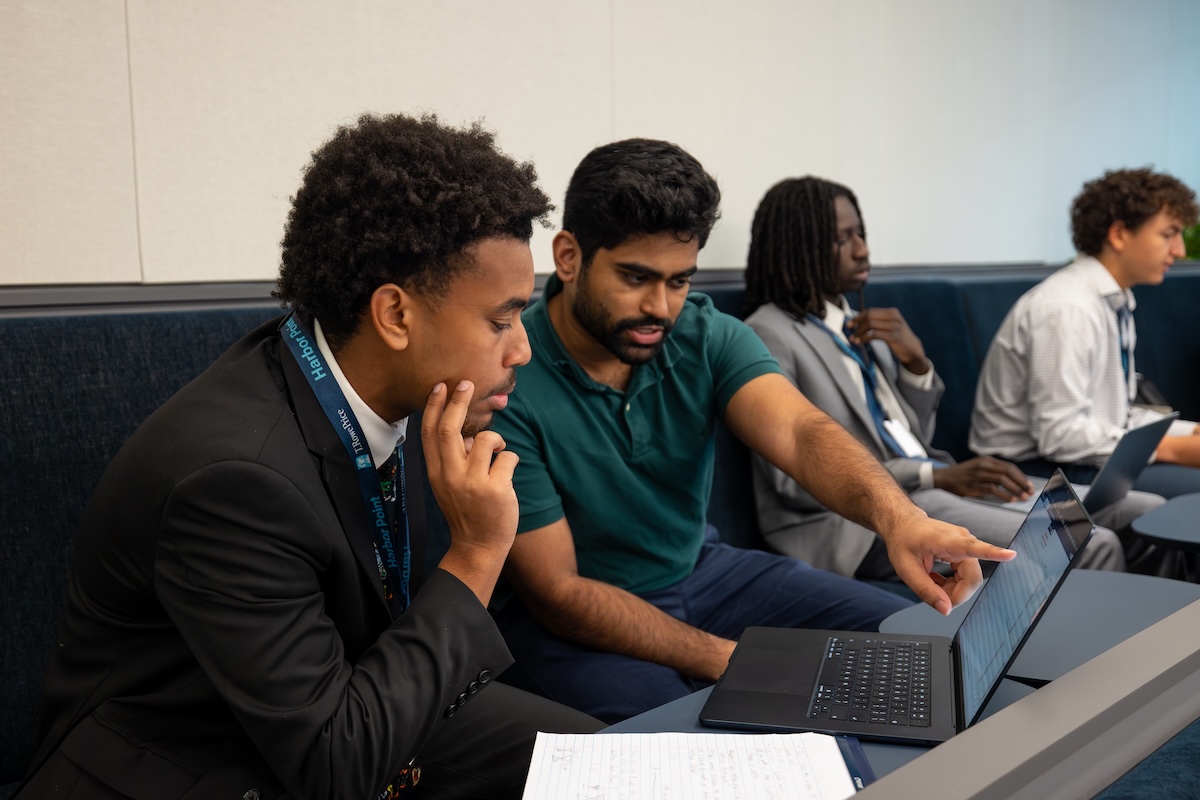
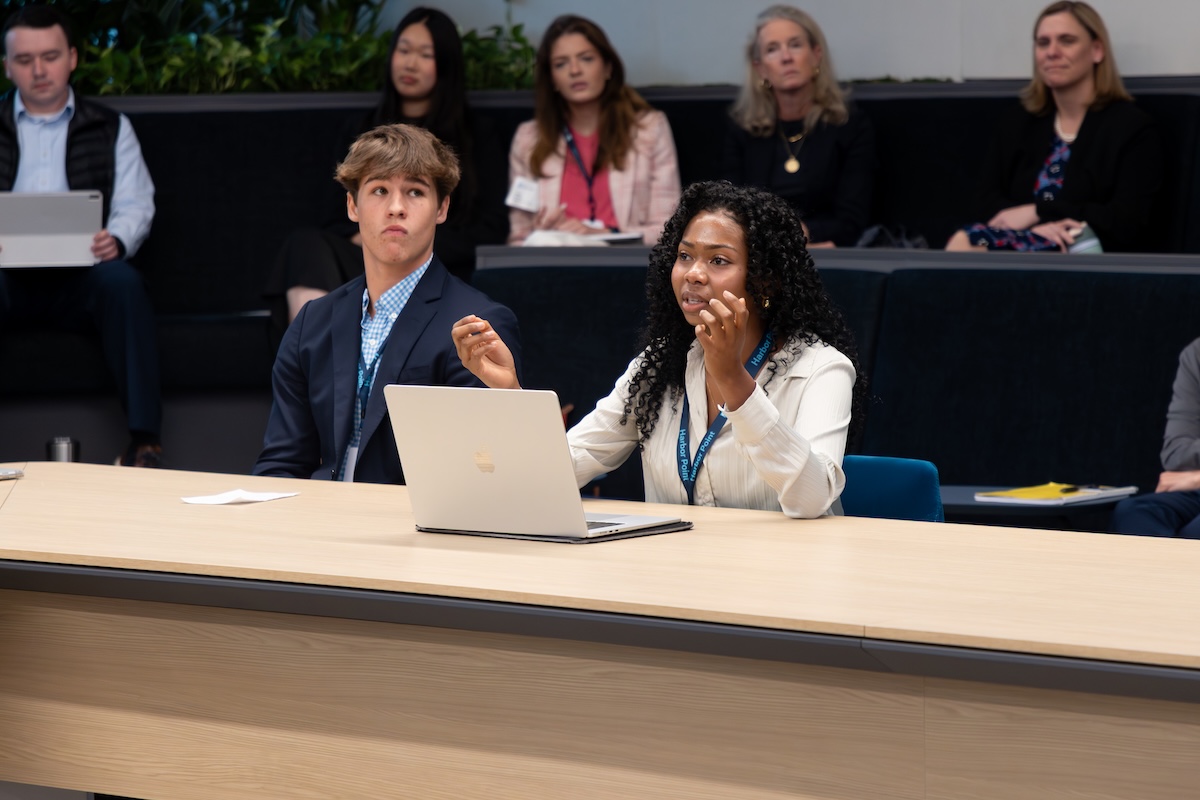
T. Rowe Price hosted its weeklong, in-person High School Encounter program May 18–22, 2026, bringing 32 high school seniors from 20 different high schools in the Class of 2026 to the firm’s Baltimore headquarters for early exposure to asset management and finance careers. Students were selected through a competitive process based on academic achievement, engagement, and interest in business, finance, or investing.
The program featured sessions led by current and former investment professionals on investing fundamentals, finance careers and asset management. It supports T. Rowe Price’s early talent strategy by helping students from diverse backgrounds explore careers in the industry.
In a recent discussion with Rockwell Automation ROKStudios, Tony Wibbeler, founder and CEO of Bolder Industries, outlined a vision for accelerating the shift to circular manufacturing, emphasizing the importance of clear strategy, advanced technology, and strong partnerships. Bolder Industries is a circular-economy infrastructure platform that transforms end-of-life tires into essential, sustainable materials for the tire, rubber, plastics, and petrochemical industries.
In this interview, Wibbeler talked about the challenge of scale and described efforts to expand circular manufacturing operations across regions, particularly in the United States and Europe. Achieving this requires standardized processes, repeatable plant designs, and consistent quality across facilities, ensuring that growth does not come at the expense of efficiency or reliability.
Equally important, Wibbeler emphasized, is collaboration. Partnerships between companies like Bolder Industries and Rockwell Automation bring together expertise in manufacturing, digital solutions, and system integration, helping accelerate deployment and strengthen operational outcomes.
While challenges remain, including system integration and global alignment, the discussion underscored a clear takeaway: scaling circular manufacturing is not just an environmental goal, but a strategic business priority. When done effectively, it can deliver both economic value and meaningful sustainability impact for the industry.