
DENVER–(BUSINESS WIRE)–Voyager Technologies, Inc. (“Voyager”) (NYSE: VOYG) today announced the pricing of its offering of $350,000,000 aggregate principal amount of 0% convertible senior notes due 2032 (the “notes”) in a private offering to persons reasonably believed to be qualified institutional buyers pursuant to Rule 144A under the Securities Act of 1933, as amended (the “Securities Act”). The issuance and sale of the notes are scheduled to settle on September 28, 2026, subject to customa
Category: Uncategorized
DENVER–(BUSINESS WIRE)–Voyager Technologies, Inc. (“Voyager”) (NYSE: VOYG) today announced the pricing of its offering of $350,000,000 aggregate principal amount of 0% convertible senior notes due 2032 (the “notes”) in a private offering to persons reasonably believed to be qualified institutional buyers pursuant to Rule 144A under the Securities Act of 1933, as amended (the “Securities Act”). The issuance and sale of the notes are scheduled to settle on September 28, 2026, subject to customa
DENVER–(BUSINESS WIRE)–Voyager Technologies, Inc. (“Voyager”) (NYSE: VOYG) today announced the pricing of its offering of $350,000,000 aggregate principal amount of 0% convertible senior notes due 2032 (the “notes”) in a private offering to persons reasonably believed to be qualified institutional buyers pursuant to Rule 144A under the Securities Act of 1933, as amended (the “Securities Act”). The issuance and sale of the notes are scheduled to settle on September 28, 2026, subject to customa
10.19 g/t AuEq over 10.50 m marks the highest-grade intercept of down-plunge extension
VANCOUVER, British Columbia, Sept. 14, 2026 (GLOBE NEWSWIRE) — Blue Jay Gold Corp. (TSXV: JAY) (OTCQB: JAYGF) (FSE: JAY) (“Blue Jay” or the “Company”), is pleased to announce the first assay results from its maiden 2026 diamond drill program at the Steller Gold Project (“Steller” or the “Project“) in the Yukon Territory. Hole SC26-003 returned 14.00 metres (m) of 6.15 grams per tonne (g/t) gold (Au) and 124 g/t silver (Ag), or 8.04 g/t gold equivalent (AuEq), from 495.00 m, including 10.50 m of 7.84 g/t Au and 154 g/t Ag (10.19 g/t AuEq). The intersection represents an approximate 32 m down-plunge extension of the mineralization intersected in drill hole SC21-027, which returned 14.8 m of 5.79 g/t Au and 100.9 g/t Ag in 20211. The results highlight continuity of the mineralization and its host structure across multiple intercepts, with room for further expansion. The system displays an intermediate sulfidation epithermal style comparable to giant districts such as Fresnillo, Zacatecas and Pachuca in Mexico. Intercepts extending from surface to over 500 m down dip demonstrate the continuity and scale potential of the Skukum Creek system. Initial drilling at Mt. Skukum, the site of historical gold production between 1986 and 1988, returned 0.5 m of 57.4 g/t Au and 44.1 g/t Ag from 160.8 m in hole MS26-001. The historical high-grade production at Mt. Skukum, combined with the presence of multiple undertested vein sets, points to resource growth potential on this target corridor. The Company has identified similar potential for expansion along strike at other target areas across the Project’s 170 km² land package.
“SC26-003 is the kind of result we underwrote when we bought this project,” said Geordie Mark, CEO of Blue Jay Gold. “It confirmed mineralization more than 30 metres down-plunge of SC21-027, drilled in 2021, with effectively the same width, grade and grade distribution. That is what continuity looks like: not just a string of separate hits, but a zone you can follow. We identified this area as being completely open to depth and down-plunge. That was the call, and we have delivered results that exemplify our thesis.”
Most exploration programs start with a blank map. Steller handed us one already partly drawn, aided by historical drilling, 7.5 kilometres of underground development, and a high-grade resource in the ground. What has never existed is a structural framework that explains where the grade goes, and a hydrothermal model that predicts where other mineralized systems could be.”
“Hyperspectral core logging is central to how we are building it,” added Mark. “We have now put roughly 18,000 metres of historical core through the scanner system, reading alteration mineral distribution and chemistry directly from the core ahead of assay results from the lab. It shows a consistent, zoned alteration envelope around the mineralized structures that points toward mineralization. Every metre we scan turns rock we already own into data we can use to refine targets.
At Mt. Skukum, our first hole returned a high-grade intercept at the site of the former Mt. Skukum mine, which produced gold between 1986 and 1988. Seeing grades of that order in our own first holes tells us the system at Steller is not confined to a single deposit.
We are only about 3 months after listing, and the picture we formed in due diligence of Steller is holding. Rigs are turning and assays are pending on further holes. Today’s results are the first assay confirmation that the framework we are building points the right way.”
Highlights
- High-grade down-plunge extension at Rainbow Zone at Skukum Creek: 14.0 m of 6.15 g/t Au and 124.1 g/t Ag (8.04 g/t AuEq) from 495.0 m in SC26-003, including 10.50 m of 7.84 g/t Au and 154.0 g/t Ag (10.19 g/t AuEq), approximately 32 m below SC21-027 (14.8 m of 5.79 g/t Au, 100.9 g/t Ag) (Figure 1).
- Mineralization is continuous within the structure between drill holes: SC26-003 returned essentially the same width and grade as SC21-027, which is >30 m up-plunge. The structure carries consistent gold and silver tenor between the two holes rather than occurring as isolated lenses.
- Our interpretation, now drill-tested: we projected that this zone was open. SC26-003 is the first drilling phase to test it and has unearthed that reality.
- Hyperspectral logging of 18,000 m of core has produced a vectoring tool: a consistent, zoned alteration envelope wrapped around the mineralized structures, measurable directly in core and applicable to material already in the core yard. It has generated new targets along the Skukum Creek Structural Corridor.
- First drilling at Mt. Skukum returns high-grade gold: MS26-001 returned 0.5 m of 57.4 g/t Au from 160.8 m, on the site of the former Mt. Skukum gold mine, which recovered 77,790 ounces of gold between 1986 and 1988.
- Initial batch of many: 5 holes are reported today, with assays pending for further holes that have been completed. Mineralization at Skukum Creek remains open down-plunge and along strike, and rigs are turning.
- 2026 Technical Report. TECHNICAL REPORT AND UPDATED MINERAL RESOURCE ESTIMATE OF THE STELLER GOLD PROJECT, WHITEHORSE MINING DISTRICT, YUKON TERRITORY, CANADA. P&E Mining Consultants Inc. Effective Date: Oct. 31, 2025. Cut-off: 3.0 g/t AuEq. Au: US$2,850/oz. Ag: US$34.20/oz. AuEq ratio = Au:Ag 85.6:1
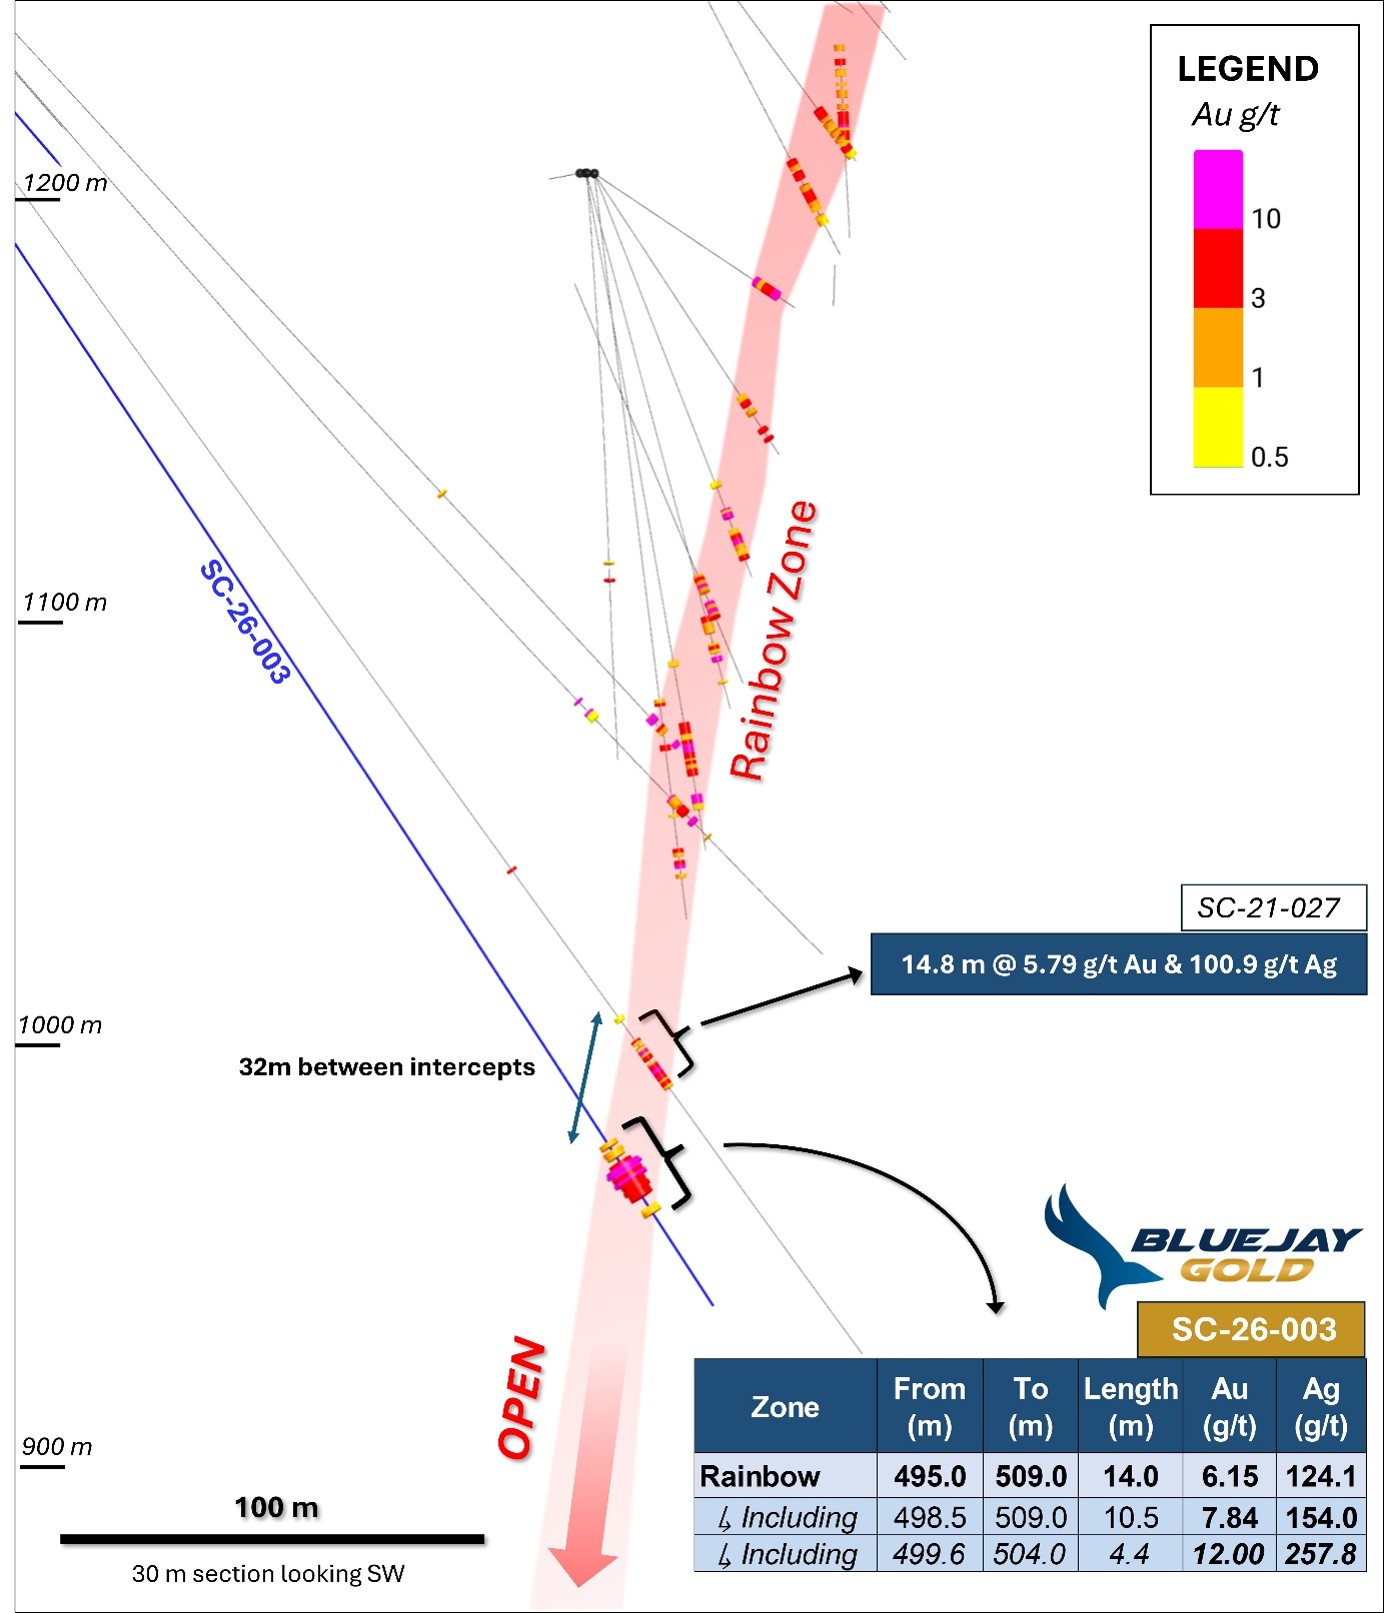
Figure 1: Cross-section through the Rainbow zone that highlights the continuity of the Au-Ag mineralization, and the >30 metre down dip extension of SC-26-003 compared with the most proximal intersection (SC-21-027). Holes being surveyed during drilling.
Table 1: Assay Results
| Location | From (m) | To (m) | Au (g/t) | Ag (g/t) | AuEq (g/t)1 | Interval (m) |
| Skukum Creek | ||||||
| SC-26-003 | 495.00 | 509.00 | 6.15 | 124.0 | 8.04 | 14.00 |
| including | 498.50 | 509.00 | 7.84 | 154.0 | 10.19 | 10.50 |
| And including | 499.60 | 504.00 | 12.00 | 258.0 | 15.94 | 4.40 |
| SC-26-001 | 444.63 | 448.96 | 4.63 | 74.0 | 5.76 | 4.33 |
| SC-26-004* | 377.00 | 378.00 | 1.15 | 0.2 | 1.15 | 1.00 |
| Mt. Skukum | ||||||
| MS (26-01) | 160.80 | 161.30 | 57.40 | 44.1 | 58.07 | 0.50 |
This press release is reporting on the first three holes at Skukum Creek hole 1, 3 and 4 and holes 1 and 4a at Mt. Skukum which is 200 samples in total. True widths are estimated at approximately 60-80 % of the down-hole interval based on currently available results and observations. Interval average grades are calculated using un-capped assays. Composites are calculated using a 1.0 g/t AuEq cut-off grade with a maximum of 2.0 m of internal dilution of below-cut-off material and a minimum composite length of 1.0 m.
- Gold equivalent (AuEq) is calculated as AuEq (g/t) = Au (g/t) + [Ag (g/t)]*($67*0.93/$4300*0.95)], using US$4,300/oz gold and US$67.00/oz silver. Project recoveries of 95% for gold and 93% for silver and are consistent with the assumptions used in the Mineral Resource Estimate with an effective date of October 31, 2025. AuEq values are provided for comparison only and do not reflect payable metal.
Hole SC26-001 returned 4.33 m of 4.63 g/t Au and 74.0 g/t Ag (5.76 g/t AuEq) from 444.63 m to 448.96 m, lending further support to the continuity of mineralization at Skukum Creek. Hole SC26-004 deviated from its planned trajectory and did not reach its intended target, returning 1.00 m of 1.15 g/t Au and 0.2 g/t Ag (1.15 g/t AuEq) from 377.00 m to 378.00 m in a separate zone for subvertical Au-Ag mineralization. The Company plans to re-drill this target in a future phase of the program.
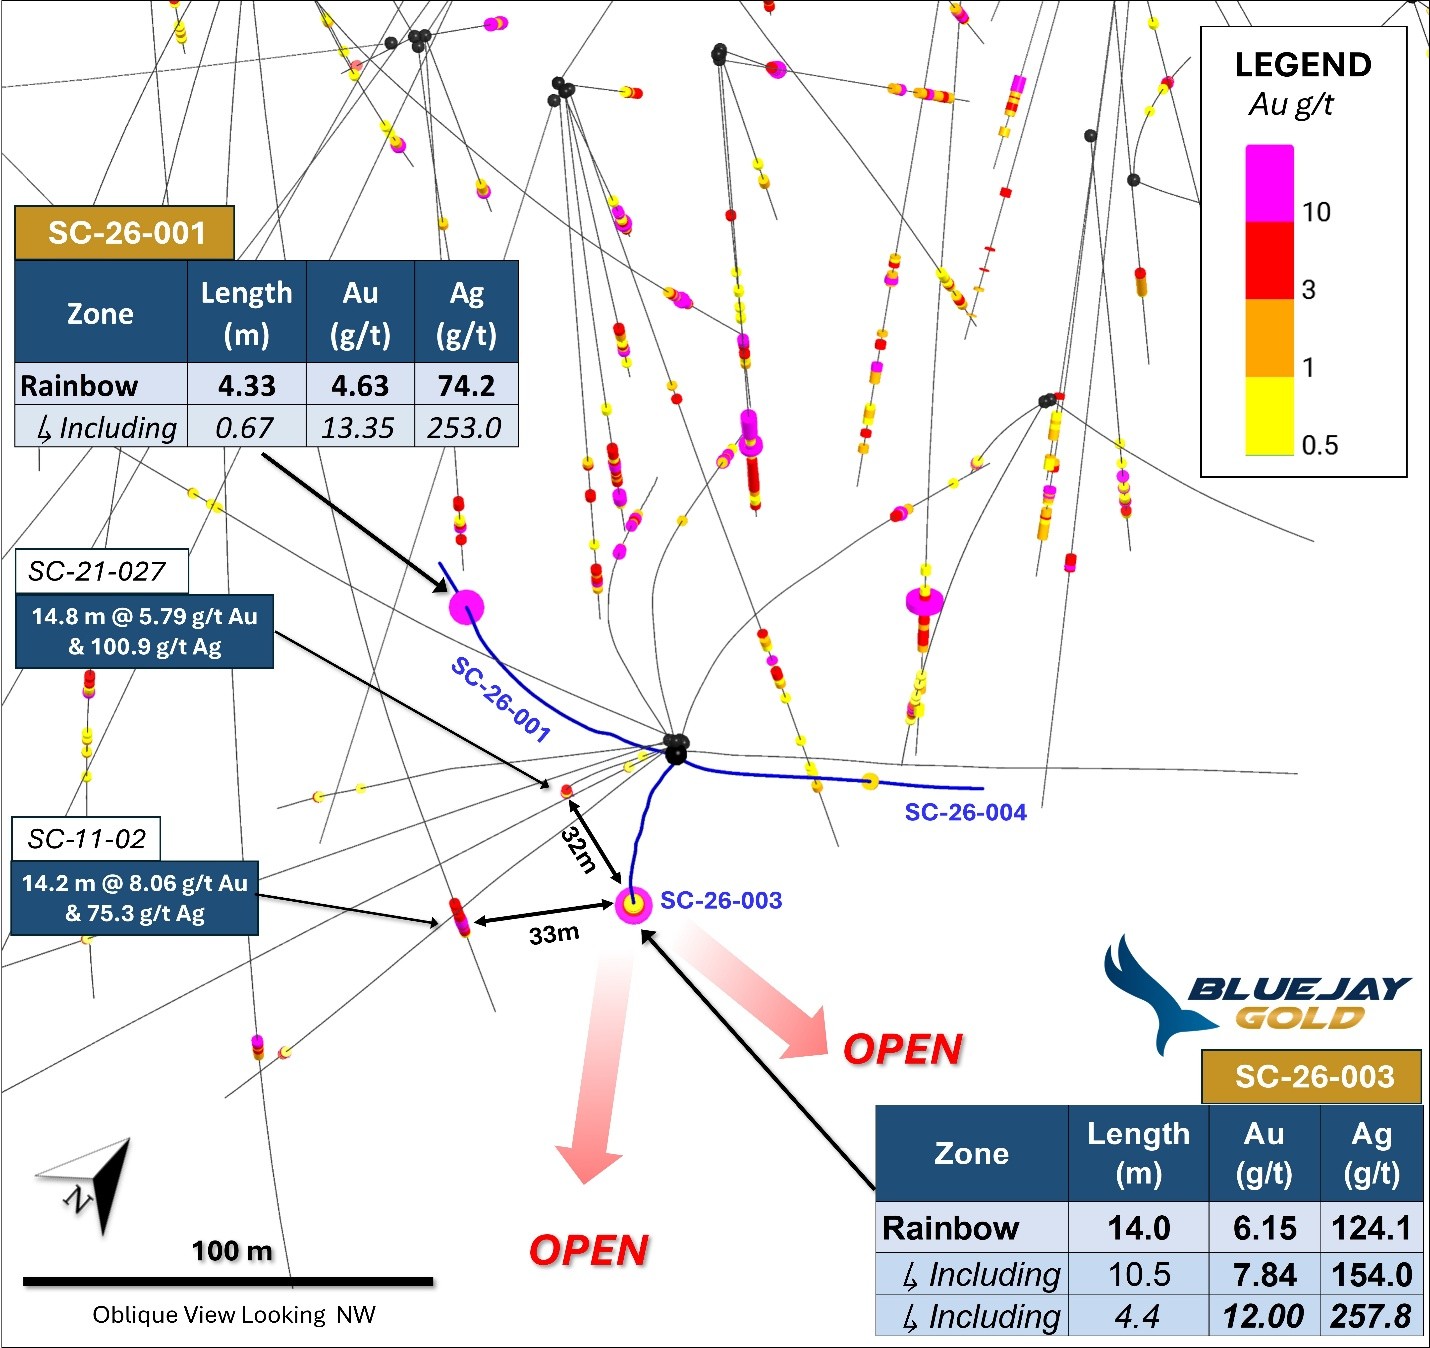
Figure 2: Skukum Creek Plan Section showing drill traces for initial holes from 2026, compared with historical holes on the Northeast portion of the deposit area. Note that SC-26-004 drill hole deviated off target and out of structural plane.
Table 2: Drill Hole Collar Locations
| Hole ID | East | North | Elevation | Depth | Dip | Azimuth |
| SC-26-001 | 478102 | 6671141 | 1386 | 529 | -52 | 300 |
| SC-26-003 | 478102 | 6671141 | 1386 | 542 | -56 | 307.5 |
| SC-26-004 | 478102 | 6671141 | 1386 | 537 | -56 | 314.5 |
| MS-26-001 | 473531 | 6674889 | 1913 | 222 | -66.5 | 065 |
| MS-26-004A | 473455 | 6674883 | 1916 | 213 | -54 | 112 |
Next Steps
Drilling is ongoing. Follow-up holes are being planned to test further down-plunge and along strike continuity of mineralization on the Rainbow zone. Drill results are expected to be delivered from Skukum Creek and other target areas on Steller during and post the completion of the exploration program.
Drilling and Geology Discussion
Structural Setting and Controls on Mineralization
The 2026 Skukum Creek drill program is testing structural extensions to Au-Ag mineralization hosted within composite breccia-shear zones. These zones acted as fluid conduits and record multiple pulses of overprinting hydrothermal alteration, Au-(Ag) mineralization and coeval felsic to intermediate dyking, all formed during the Eocene. This system is comparable to major epithermal districts including Guanajuato, Pachuca-Real del Monte, Fresnillo and Tayoltita in Mexico, and the Comstock district in Nevada and Creede in Colorado in the United States. These districts share a similar Eocene-Oligocene age and formed within calderas and large volcanic complexes, comparable to the geological systems preserved across the Stellar project.
Rainbow Zone Down-Plunge Extension
The holes reported today are the first tranche of results from the 2026 program and test the down-plunge extension of the Rainbow Zone.
SC26-003 extends high-grade Au-Ag mineralization >30 m down-plunge of SC-21-027, drilled in 2021. The intersection grades 8.04 g/t AuEq. over 14 m and preserves the across-structure grade distribution seen up-plunge. Equally important, the holes confirm that the bounding structures are continuous and that they remained active as conduits through repeated pulses of hydrothermal alteration, mineralization and Eocene dyking. This dyking is comparable to that found in the Mexican examples of major intermediate sulfidation systems, which can extend more than 1 km vertically and 8 km along strike, forming multi-million AuEq systems that enjoyed protracted mining histories. Our framework exploration represents the first systematic integration of Steller’s historical data within the geological context of these major epithermal systems and the application of next generation geological tools (e.g., LithologIQ) to unravel Stellar’s potential.
Not to be overlooked, SC26-001 returned 4.33 metres grading 5.70 g/t AuEq. on the Rainbow Zone and importantly shows continuity of the structure that hosts mineralization. The Au-Ag mineralization is hosted within composition vein-breccia that is spatially associated with the same alteration patterns witnessed in SC26-003, as such we are developing an improved confidence in the hydrothermal evolution of this system.
Hyperspectral Core Logging and Alteration Zoning
Blue Jay has completed hyperspectral logging of approximately 18,000 m of archived drill core. The results show a consistent, zoned alteration envelope along and up-dip of the mineralized structures. Measured as down-hole lengths outward from the mineralized zone, the envelope grades from an outer white-mica-rich halo of more than 100 m, through an inner halo of up to 90 m in which chlorite becomes progressively more Fe-rich, to a proximal zone of tens of metres in which hydrothermal carbonate is Mg-rich.
The practical value is vectoring. The zoning is measurable in core, it repeats across holes, and it can be applied to material already in the core yard. It has generated new targets within the strike length of the mineralized corridor. This begins to define the scale potential for multiple target areas that warrant broad step out drilling.
The Skukum Creek Structural Corridor
Skukum Creek mineralization is currently defined over a strike length of more than 1 km. It sits within the Skukum Creek Structural Corridor, which extends for more than 15 km as defined by regional magnetic data and comprises a zone of multiple sub-parallel and curvilinear structures: the continuity and distribution of these structures were unmapped before magnetics could be interrogated.
These structures are interpreted as second order features relative to a longer-wavelength, north-south trending, deeper penetrative structure that shows spatial association with Eocene dyke swarms. Both the corridor length and the structural hierarchy are interpretations drawn from airborne magnetics, that was reprocessed and reinterpreted in 2026.
District-Scale Associations
The same spatial and temporal associations between alteration, mineralization, dyking and dilation are seen at Raca, at Goddell Gully, and more broadly across the Tellurium-rich, low sulphidation epithermal vein field at Mt. Skukum. North-south and east-west trending composite dyke swarms are documented across that field and around Skukum Creek, Raca, Chieftain and Goddell. Comparable associations are mapped historically along east-west trending composite dyke sets of rhyolitic, andesitic and quartz-feldspar porphyry composition east of Skukum Creek, where copper- and molybdenum-bearing mineralization is also present.
At depth in the altered footwall of the Rainbow Zone, a sub-population of quartz-pyrite-molybdenite veins has been documented. These form part of a hydrothermal evolution progressing from early potassic alteration, through localized magnetite alteration and sericite-quartz-chlorite alteration, to Au-Ag mineralization with Mg-rich carbonate, and finally to late low-temperature epithermal quartz veining. This progressive hydrothermal, magmatic and chemical evolution bears similarities to the geological systems documented in Guanajuato and Creede Colorado.
That progression, together with the copper-molybdenum mineralization east of Skukum Creek and the quartz-feldspar porphyry dykes, is interpreted as consistent with hydrothermal centres being driven by magmatic intrusions at depth. No drilling has ever tested that integrated interpretation, and no such target construction has been defined before.
Oriented Core
Oriented core is being collected at Steller and will be used for the first time in the property’s history. It is one of the defining elements of this framework year of exploration and gives Blue Jay the capacity to target future drilling across a project that shows district-scale mineralization with broad commonalities within a major regional architecture.
Market Making Engagement
The Company announces that it has engaged the services of ICP Securities Inc. (“ICP”) to provide automated market making services, including use of its proprietary algorithm, ICP Premium® in compliance with the policies and guidelines of the TSX Venture Exchange (the “Exchange”) and other applicable legislation. ICP will be paid a monthly fee of C$7,500, plus applicable taxes. The agreement between the Company and ICP was signed with a start date of September 10th, 2026, and is for four (4) months (the “Initial Term”) and shall be automatically renewed for subsequent one (1) month terms (each month called an “Additional Term”) unless either party provides at least thirty (30) days written notice prior to the end of the Initial Term or an Additional Term, as applicable. There are no performance factors contained in the agreement and no stock options or other compensation in connection with the engagement. ICP and its clients may acquire an interest in the securities of the Company in the future. The Company’s engagement of ICP remains subject to the approval of the Exchange.
ICP is an arm’s length party to the Company. ICP’s market making activity will be primarily to correct temporary imbalances in the supply and demand of the Company’s shares. ICP will be responsible for the costs it incurs in buying and selling the Company’s shares, and no third party will be providing funds or securities for the market making activities.
Quality Assurance and Quality Control
Drill core was transported from the drill platform to the logging facility where it was logged, photographed, and samples split by diamond saw. Samples were then bagged, and a blank, duplicate or certified reference material inserted into the sample stream every 10 samples. Samples were submitted by hole, and placed in large sacks, sealed with numbered tags in order to maintain a chain-of-custody, and transported to ALS Laboratories in Whitehorse, Yukon where they were shipped by ALS to the prep and analytical lab in North Vancouver, British Columbia.
Individual samples were crushed to 2mm (10 mesh) and a 250g split was ground until at least 85% of the material passes through a 75-micron (75 µm / <200 mesh) screen. Samples were prepared for analysis according to ALS method ME-MS61 where multi-element (48) geochemical analysis was performed by four-acid digest of a 0.25g split followed by a combination of ICP-AES and ICP-MS finishes. Over-limits for gold and silver samples were re-analyzed using ALS method ME-GRA21 where a 30g split is analyzed with fire assay and gravimetric finish.
All results passed the QA/QC screening at the lab, all company inserted standards and blanks returned results that were within acceptable limit.
Qualified Person
The scientific and technical content of this news release has been reviewed and approved by Freeman Smith, P.Geo., VP Exploration of Blue Jay Gold Corp., who is a Qualified Person as defined by National Instrument 43-101 – Standards of Disclosure for Mineral Projects.
About ICP Securities Inc.
ICP Securities Inc. is a Toronto based CIRO dealer-member that specializes in automated market making and liquidity provision, as well as having a proprietary market making algorithm, ICP Premium®, that enhances liquidity and quote health. Established in 2023, with a focus on market structure, execution, and trading, ICP has leveraged its own proprietary technology to deliver high quality liquidity provision and execution services to a broad array of public issuers and institutional investors.
About Blue Jay Gold Corp.
Blue Jay Gold Corp. is a Canadian gold exploration company focused on growing and discovering resources within established gold producing regions in Canada. The Company’s flagship asset is the 100%-owned Steller Gold Project in southern Yukon, an infrastructure-supported, past-producing mine with significant exploration upside and clear near-term catalysts. Blue Jay has also built a portfolio of projects in Ontario. With strategically located assets and a leadership team experienced in geology and capital markets, Blue Jay will advance disciplined, modern exploration programs focused on target definition, resource growth, and new discoveries in known gold-mineralized regions. For more information, please visit: www.bluejaygoldcorp.com.
ON BEHALF OF BLUE JAY GOLD CORP.
signed “Geordie Mark”
Geordie Mark, CEO
For additional information contact:
BLUE JAY GOLD CORP.
| Geordie Mark CEO Blue Jay Gold Corp. info@bluejaygoldcorp.com Phone: (604) 235-4059 |
Eric Negraeff Investor Relations Blue Jay Gold Corp. eric@bluejaygoldcorp.com Phone: (604) 235-4059 |
Cautionary Note Regarding Forward-Looking Statements
Certain statements in this press release contain forward-looking information. Forward-looking information involves risks, uncertainties and other factors that could cause actual results to differ materially from those expressed or implied by such forward-looking information. In addition, the forward-looking statements require management to make assumptions and are subject to inherent risks and uncertainties. There is significant risk that the forward-looking statements will not prove to be accurate, that the management’s assumptions may not be correct and that actual results may differ materially from such forward-looking statements.
These statements can be identified by the use of forward-looking terminology (e.g., “expect”,” estimates”, “intends”, “anticipates”, “believes”, “plans”). Forward-looking statements contained in this press release may include, but are not limited to, the results of the Skukum Creek drill program (including drilling of the Rainbow Zone and other areas of Steller), the timing and scope of the rest of the Company’s exploration program, and future business plans of the Company. Such information involves known and unknown risks, including the receipt of regulatory approval, the results of future financing and exploration activities, the interpretation of exploration results and other geological data, or unanticipated costs and expenses and other risks identified by Blue Jay in its public securities filings that may cause actual events to differ materially from current expectations. Readers are cautioned not to place undue reliance on these forward-looking statements, which speak only as of the date of this press release. Except as required by applicable securities laws and regulation, Blue Jay disclaims any intention or obligation to update or revise any forward-looking statement, whether as a result of new information, future events or otherwise.
Photos accompanying this announcement are available at:
https://www.globenewswire.com/NewsRoom/AttachmentNg/13c6cc00-5441-40b1-bc19-27c5c6a877c2
https://www.globenewswire.com/NewsRoom/AttachmentNg/161f3677-c0b5-4fad-980a-214d386c90ba

LONDON–(BUSINESS WIRE)– FORM 8.3 PUBLIC OPENING POSITION DISCLOSURE/DEALING DISCLOSURE BY A PERSON WITH INTERESTS IN RELEVANT SECURITIES REPRESENTING 1% OR MORE Rule 8.3 of the Takeover Code (the “Code”) 1. KEY INFORMATION (a) Full name of discloser: Millennium International Management LP (b) Owner or controller of interests and short positions disclosed, if different from 1(a): The naming of nominee or vehicle companies is insufficient. For a trust, the trustee(s), settlor and beneficiari
LONDON–(BUSINESS WIRE)– FORM 8.3 PUBLIC OPENING POSITION DISCLOSURE/DEALING DISCLOSURE BY A PERSON WITH INTERESTS IN RELEVANT SECURITIES REPRESENTING 1% OR MORE Rule 8.3 of the Takeover Code (the “Code”) 1. KEY INFORMATION (a) Full name of discloser: Millennium International Management LP (b) Owner or controller of interests and short positions disclosed, if different from 1(a): The naming of nominee or vehicle companies is insufficient. For a trust, the trustee(s), settlor and beneficiari
Key Takeaways: PFAS and Financial Risk
- Per and polyfluoroalkyl substances (PFAS) are a growing financial liability, not just an environmental issue, affecting asset values, loan security, insurance coverage, and Merger & Acquisition (M&A) transactions.
- Regulatory risk is accelerating globally, with expanding state-level enforcement and specific PFAS-containing product bans in the U.S., Comprehensive Environmental Response Compensation and Liability Act (CERCLA) liability exposure, and international prohibitions such as Australia’s Industrial Chemicals Environmental Management Standard (IChEMS) framework.
- Failure to screen for PFAS during underwriting or due diligence can result in Potentially Responsible Party (PRP) liability, litigation, borrower default, and multimillion-dollar remediation costs.
- Financial institutions should integrate PFAS screening into Phase I/II ESAs, portfolio risk assessments, supply chain reviews, and M&A negotiations.
- Proactive PFAS risk management reduces financial exposure, improves underwriting clarity, and protects long-term portfolio stability.
PFAS are not just an environmental problem. They are a rapidly escalating financial risk for lenders, insurers, and investors. This remains true despite the recent delays and rollbacks of some PFAS regulations under the current presidential administration.
From loan portfolios and M&A due diligence to insurance claims and investment decisions, PFAS contamination is reshaping the financial landscape. The risks associated with these “forever chemicals” are as real and persistent as the compounds themselves.
Proactively identifying, assessing, and managing PFAS-related financial exposures is critical for financial institutions to mitigate risk, protect assets, and ensure long-term stability.
Where PFAS Poses Financial Risks
The widespread use of PFAS in manufacturing, combined with the ability of these chemicals to filter into the environment, means that the financial risks associated with them are extremely far-reaching. These are just some of the segments that can feel surprisingly strong effects of PFAS implications:
- Real Estate and Property Values: Properties affected by PFAS contamination can lose significant value, become unsellable, or require extensive remediation.
- Loan Portfolios: Financial institutions face increased risk of loan defaults tied to contaminated properties or businesses burdened by cleanup costs, regulatory penalties, or litigation.
- M&A Due Diligence: Unquantified PFAS liabilities can derail transactions or lead to unexpected post-acquisition losses.
- Insurance Claims: As PFAS-related environmental claims continue to grow insurers are increasingly excluding PFAS from pollution coverage.
- Investment Decisions: Transparency around PFAS management has become a differentiator for companies seeking capital.
- Litigation and Reputational Risk: As regulatory enforcement increases, financial institutions and insured clients face litigation exposure, with the distinction between intentional and unintentional PFAS use emerging as a key factor.
Understanding PFAS Risks in Financial Contexts
To evaluate PFAS exposure effectively, financial institutions must understand two core drivers of risk: where contamination originates, and how regulatory frameworks assign liability. These factors directly influence asset valuation, underwriting decisions, and long-term portfolio stability.
Key Sources of Contamination
PFAS contamination often stems from industrial, municipal, and consumer product sources. This includes manufacturing and firefighting foam to wastewater discharge and everyday consumer goods. These chemicals are now found in most U.S. municipal water supplies, making PFAS nearly impossible to avoid in property and portfolio risk assessments.
Evolving PFAS Regulations
While certain federal PFAS rules in the United States have recently been delayed or narrowed, regulatory momentum has not slowed overall. Instead, it has shifted, with states and international jurisdictions accelerating their own enforcement frameworks.
States including California, Massachusetts, Michigan, New York, and New Jersey continue advancing aggressive PFAS investigation, reporting, and cleanup requirements. Roughly half of U.S. states now have PFAS-related laws in place, particularly targeting consumer products such as food packaging, textiles, personal care items, and children’s products.
Globally, the regulatory landscape is tightening further. In Australia, the IChEMS) framework took effect nationwide on July 1, 2025, prohibiting the import, manufacture, export, and use of certain PFAS — including perfluorooctanoic acid (PFOA), perfluoroocatne sulfonic acid (PFOS), and perfluorohexane sulfonic acid (PFHxS) — unless exempted. All states and territories have adopted the framework, and non-compliance may be treated as a pollution incident, exposing companies to enforcement and penalties.
At the international level, the Stockholm Convention continues expanding restrictions on long-chain PFAS production and trade, reinforcing a broader global phase-down of high-risk compounds.
For multinational lenders and investors, these global regulatory shifts introduce jurisdiction-specific liability exposure that can materially affect asset valuation, underwriting decisions, and long-term portfolio stability.
Because PFAS regulations are evolving rapidly and unevenly across jurisdictions, keeping up to date on all of them can feel like a full-time job. The Antea Group Global PFAS Regulatory Dashboard provides clear, real-time visibility into PFAS regulatory activity worldwide, helping companies stay ahead of compliance changes and avoid unexpected liabilities. If your organization is unsure where it stands or how new requirements may apply, reach out to our team for guidance.
Strategies for Assessing and Managing PFAS Financial Exposure
Once PFAS risk drivers are understood, financial institutions must translate that insight into structured mitigation strategies. The following approaches help lenders, insurers, and investors quantify exposure across assets, transactions, and value chains — and reduce the likelihood of unexpected financial loss.
1. Enhanced Environmental Due Diligence
Integrate PFAS screening into Phase I and II Environmental Site Assessments (ESAs) to identify potential contamination early.
2. Portfolio Screening and Risk Ranking
Perform PFAS portfolio risk assessments to identify high-risk assets or companies based on historical site use, industry sector, and proximity to known PFAS sources.
3. Supply Chain PFAS Screening and Transparency
Screen supply chains for intentional and unintentional PFAS use to anticipate regulatory, product liability, and valuation risks.
4. Underwriting and Policy Development
Insurers should revisit policy language, exclusions, and underwriting practices to better address PFAS-related risks.
5. Contractual Protections in M&A
Include PFAS-specific indemnities, representations, and warranties to allocate liability appropriately between buyers and sellers during M&A transactions.
6. Probabilistic Cost Modeling
Use PFAS cost modeling and scenario-based analysis to estimate potential remediation, compliance, and litigation expenses.
7. Strategic Communication
Engage transparently with stakeholders, such as investors, borrowers, and regulators, about PFAS risks and mitigation strategies to build trust and confidence.
Case Example: Structured Due Diligence Preserves Deal Value
A private equity firm acquiring a power generation facility in Wisconsin incorporated targeted PFAS screening into its environmental review. Consultants identified historical use of aqueous film-forming foam (AFFF) and evidence of prior discharge into surrounding soils.
Armed with this information, the buyer negotiated a reduced purchase price and required the seller to retain responsibility for ongoing remediation, including soil excavation and groundwater monitoring.
By integrating enhanced due diligence, contractual protections, and forward-looking cost modeling, the buyer preserved transaction value and avoided inheriting significant long-term liabilities.
PFAS Remediation Challenges and Cost Implications
PFAS remediation is technically demanding and expensive, with no universal solution. Current remediation approaches often involve removing PFAS from contaminated water or soil and then using specialized treatment methods to destroy or permanently manage the chemicals. While newer destruction technologies show promise, they remain costly, complex, and not yet widely available. This contributes to uncertainty in cleanup timelines and total project costs.
For financial stakeholders, that uncertainty translates directly into cost variability and long-term liability. Cleanup expenses can easily reach into the millions, depending on site conditions, regulatory requirements, and evolving treatment standards. This cost variability can materially affect property valuations, loan security, insurance coverage, and investment performance, making early risk identification and realistic cost modeling essential.
By contrast, a national lender that financed redevelopment of a former industrial property without PFAS screening during underwriting later faced significant consequences when contamination was discovered years after closing. Historical use of firefighting foam and surface coatings had resulted in elevated PFAS levels, and under updated CERCLA regulations, the lender was designated as a PRP. Litigation, regulatory scrutiny, and cleanup obligations followed.
As remediation costs escalated into the millions, the property’s value declined sharply, and the borrower ultimately defaulted — leaving the lender with a contaminated asset and long-term financial exposure that could have been mitigated through earlier screening and risk allocation.
Benefits of Proactive PFAS Risk Management
When addressed early and strategically, PFAS risk management delivers measurable financial and operational advantages for lenders, insurers, and investors. Key benefits include:
- Reduced PFAS Financial Exposure: Early identification and mitigation minimize liability and cost.
- Informed Lending and Investment Decisions: Better insight into PFAS risk profiles improves financial resilience.
- Streamlined M&A Transactions: Reduced uncertainty supports smoother deal structuring, pricing, and negotiations.
- Improved Insurance Underwriting and Claims Management: Greater risk clarity strengthens understanding of PFAS-related exposures.
- Enhanced Reputation and Regulatory Standing: Demonstrated environmental stewardship supports compliance confidence and stakeholder trust.
Case Example: Proactive Due Diligence Protects Asset Value
A mid-sized regional bank evaluating a loan for the acquisition of a former manufacturing site identified potential PFAS exposure linked to historical fire suppression systems. Rather than proceeding with a standard Phase I ESA alone, the bank commissioned targeted soil and groundwater sampling.
Elevated PFAS levels were confirmed, prompting the bank to require site remediation and environmental insurance coverage prior to closing.
This proactive approach reduced liability exposure, protected collateral value, and ensured regulatory compliance. This demonstrated how structured PFAS risk management directly supports financial resilience.
PFAS Doesn’t Have To Be “Forever”
PFAS represents a multifaceted and growing financial risk that can affect property values, portfolios, insurance coverage, and corporate transactions. Identifying and managing your financial risks associated with PFAS may seem like an impossible task, but it’s important to remember that PFAS liabilities are not forever. With the right expert advice and early identification, the risks can be effectively managed and mitigated.
How Antea Group USA Supports the Financial Sector with PFAS
Antea Group provides specialized PFAS consulting services to help financial institutions understand and manage emerging environmental liabilities. Our offerings include:
- PFAS due diligence for lending, M&A, and investment activities.
- PFAS portfolio risk assessments and cost modeling.
- Litigation and regulatory support for PFAS exposure.
- Integration with EHS due diligence to streamline environmental reviews.
With expertise in both the regulatory and financial dimensions of PFAS, Antea Group helps clients stay ahead of evolving PFAS compliance requirements while protecting business value and reputation. Do you have questions? Reach out to our experts today!
The Curiosity Cube™, a mobile science lab from MilliporeSigma, the U.S. and Canada Life Science business of Merck KGaA, Darmstadt, Germany, has begun its 2026 tour of North America, Europe, and Southern Africa. Throughout the year, over 2,000 employees and partners worldwide will step out of their laboratories, manufacturing facilities, and offices to share their skills and insights with the next generation of scientists, providing hands-on STEM experiences for an expected 62,000 students.
“Our employees work every day to impact life and health with science, and that passion makes them powerful role models for today’s students,” said Jeffrey Whitford, Vice President, Sustainability and Social Business Innovation, the Life Science business of Merck KGaA, Darmstadt, Germany. “As we mark the 10th anniversary of our SPARK™ employee volunteer program, the Curiosity Cube™ remains one of the many ways we spark curiosity and inspire confidence in students. We provide access to hands-on science by bringing the interactive, mobile lab directly to their schools.”
Inside this year’s Curiosity Cube™ are three lessons focused on synthetic biology. This topic introduces students to biology principles and highlights growing sectors within the life sciences, including research and development, healthcare, and agriculture. The three lessons include:
- Enzyme Function: Demonstrating how enzyme shapes influence biological processes using lock and key models.
- DNA Coding: Allowing students to discover how DNA “codes” affect traits and behaviors.
- Gene Activation: Highlighting how turning genes on or off can create genes that help solve real-world problems.
The eighth North American tour includes 133 events across major cities in the U.S. and Canada, including Austin, Boston, Cleveland, Durham, Houston, Kansas City, Milwaukee, San Diego, San Jose, St. Louis, Toronto, and more. For its fifth European tour, the Curiosity Cube™ will host 156 events with stops in Austria, Belgium, Czech Republic, France, Germany, Ireland, Italy, Liechtenstein, the Netherlands, Spain, Switzerland, and the U.K., with new stops in Poland, Serbia, and Slovakia. After a successful expansion to Southern Africa in 2025, the Curiosity Cube™ is returning to host 126 events alongside universities in Botswana, Eswatini, Lesotho, Namibia, South Africa, and will expand to Zambia for the first time.
To learn more about the Curiosity Cube™ mobile science lab and view the 2026 tour schedule, visit TheCuriosityCube.com and follow the Curiosity Cube™ on Instagram: @curiositycube_milliporesigma.
Climate change is increasingly shaping business decisions at the executive level. From workers’ safety to supply chain disruptions, effects of rising temperatures and extreme weather patterns have proven to be a financial risk.
In 2024 alone, 84% of S&P 500 companies aligned with the Task Force on Climate-Related Financial Disclosure, marking a 62% increase since 2021. It’s no wonder that climate risk assessments have become essential for protecting the longevity and value of a company, as well as maintaining customer and stakeholder trust.
What Is a Climate Risk Assessment?
Climate risk assessment is a process of analyzing a company’s operations, assets, and value chain to identify the most significant climate risks it could face, both now and in the future. The evaluation looks at a company through the lens of climate change, parsing how staff, operations, resources, product delivery, and finances could be affected by these external events. Overall, you want to walk away from a climate risk assessment with a clear view of what climate-related risks your business is exposed to.
Different Types of Climate Risks
Typically, climate risk assessment evaluates a business’ risks in two categories: physical and transition risks.
Physical risks are the ways in which climate change could disrupt a company’s physical assets, facilities, employees, and operations in short-term (acute) or ongoing (chronic) changes to weather. For example, excessive heat conditions could harm workers, or repeated flooding could lead to the decommissioning of a facility.
Transition risks encompass policy and law, technology, reputation, market, and more. These risks arise from the shift toward a lower‑carbon economy as policies, technologies, and market expectations evolve to reduce greenhouse gas emissions. While setting targets such as carbon neutrality or net zero can be relatively straightforward, achieving them often requires significant investment in new technologies, operational changes, and value‑chain adjustments, which can introduce unexpected costs and competitive pressures. Transition risks may also include legal and regulatory exposure if companies fail to comply with emerging climate‑related requirements, or if public disclosures about climate commitments and performance are misleading or incomplete.
How Are Climate Risk Assessments Conducted?
Climate risk assessments are complex processes that require data gathering, predictive modeling, prioritization, and ultimately, action to address what’s been uncovered in the assessment. Support from expert practitioners and consultants ensures that each step is carried out thoroughly and effectively.
Climate risk assessment begins with identifying a company’s physical and transition risks, as well as its vulnerabilities to these risks under different futures scenarios. Physical and transition risks like those outlined above can be identified through geophysical analysis, desktop research, and/or stakeholder engagement.
Vulnerability mapping, the other key component of this part of the process, assesses potential climate-related hazards and draws connections to how and where risk exposures are most likely to affect the company and its stakeholders if they are realized. This forecasts how employees, protocols, resources, communities, and investments will be directly affected by climate-related risks. Impact will vary between different arms of your business.
Vulnerability and risk exposure mapping will uncover countless risks. But because it’s not possible to tackle all of them at once, companies must prioritize identified risks. You’ll want to assess which matters the most based on urgency, possible financial losses, safety concerns, and reputational damage. Take each risk and identify those that are both highly probable (exposure) and will have the most significant impact on your company (vulnerability). Those are the ones to address first.
From there, you can develop an action plan to correct these internal issues. You can also revisit prioritizing impacts over time. Just as regulations change, so will what is most important to your business. Ongoing climate risk assessment will ensure that your company is always on the cutting edge of sustainability. It is recommended that the full climate risk assessment process be completed every 2-3 years or as the company faces large changes in geography or structure, such that may arise with mergers & acquisitions, closures, and market prioritization shifts.
Benefits of Climate Risk Assessments
Climate risk assessments are a that delivers returns to both your company and the community it serves. Here are four of the most significant ways an assessment can empower your business:
- Strengthening resilience. As the saying goes: an ounce of preparation is worth a pound of cure. Climate risk assessments prepare companies to be adaptable to the ongoing effects of climate change. It reduces moments of surprise, ensures action plans for risk-related events, and gives businesses more fortitude to bounce back from disruptions.
- Identifying opportunities. The holistic nature of a climate risk assessment means that it identifies both risks and opportunities in one exercise. The kind of deep analysis required to complete an assessment provides a fresh point of view for discovering new potential and rethinking existing work, making a compelling business case for the undertaking, beyond just addressing potential threats.
- Informing investments. With a clear view of climate risks, companies can budget for long-term climate-friendly planning. This could mean upgrading technologies, reinforcing facilities, protecting assets, and more. Either way, a business can invest to minimize future risk with confidence.
- Supporting Enterprise Risk Management (ERM). ERM is all about anticipating future mishaps. Conducting a climate risk assessment will only strengthen a company’s ERM strategy. All findings should be integrated into ERM so that climate-related risks are given the same attention as others.
Guidance on How To Get Started
While you may be on board with performing a climate risk assessment, it may take some work to get proper funding and support from executives. The first step to getting there is to engage key stakeholders within your company. Identify departments that could be affected by assessment findings, and start documenting relevant information. Enterprise-wide collaboration will be essential to the process. Teaming up with legal, finance, operations, and more will bolster your case. Additionally, when department leadership invests in climate risk assessment, it’s easier to get executives to follow. A cross-functional workshop, led by your external partner in conducting the CRA, is another opportunity to engage executives and other leaders in understanding the business value of an assessment.
However, don’t just rely on internal resources. While your company’s leaders are experts in their field, they may not be experts in climate risk assessment. Connecting with external partners who have experience in risk assessment will take the guesswork out of the process. Having an objective external expert to guide you not only through the assessment, but also through internal conversations with leaders, makes the process more efficient and effective.
Building a better future
Climate risk assessment isn’t just a tool to help you navigate the now. It’s an investment in resilience that will only enhance the long-term value of your company. If you are ready to take the next step in your commitment to sustainability and the environment, get in touch today. We offer a variety of climate-related risk assessment services to help your business stay strong and agile, no matter what extreme weather comes your way.
There’s nothing like finding that confidence in your role at work. Katherine Galindo found this confidence when she began as Lead Warehouse Specialist at our Saint-Gobain Life Sciences facility in Gaithersburg, Maryland. In this role, Katherine learned that you can do anything if you put your mind to it!
Saint-Gobain is an industry leader with thousands of talented team members who are dedicated to one unified purpose: Making the World a Better Home. With more than 160 manufacturing facilities throughout the United States and Canada, there are so many robust and fulfilling career opportunities available. You’ll have the opportunity to work with colleagues from a wide range of businesses, cultures, and experiences.
About Success in the Making
Anyone can be a manufacturer! Whether you are just starting out or transitioning your career path, the manufacturing industry presents opportunities for success. Saint-Gobain North America’s Success in the Making series features the stories of team members who built their careers in manufacturing and thrived!
Watch the full Success in the Making series on YouTube.
About Saint-Gobain
Worldwide leader in light and sustainable construction, Saint-Gobain designs, manufactures and distributes materials and services for the construction and industrial markets. Its integrated solutions for the renovation of public and private buildings, light construction and the decarbonization of construction and industry are developed through a continuous innovation process and provide sustainability and performance. The Group, celebrating its 360th anniversary in 2025, remains more committed than ever to its purpose “MAKING THE WORLD A BETTER HOME”.
€46.6 billion in sales in 2024
More than 161,000 employees, locations in 80 countries
Committed to achieving net zero carbon emissions by 2050