At the 2026 IWBI Social Sustainability Summit in Singapore, one message came through clearly: the future of sustainable finance in Asia will not be defined by carbon alone.
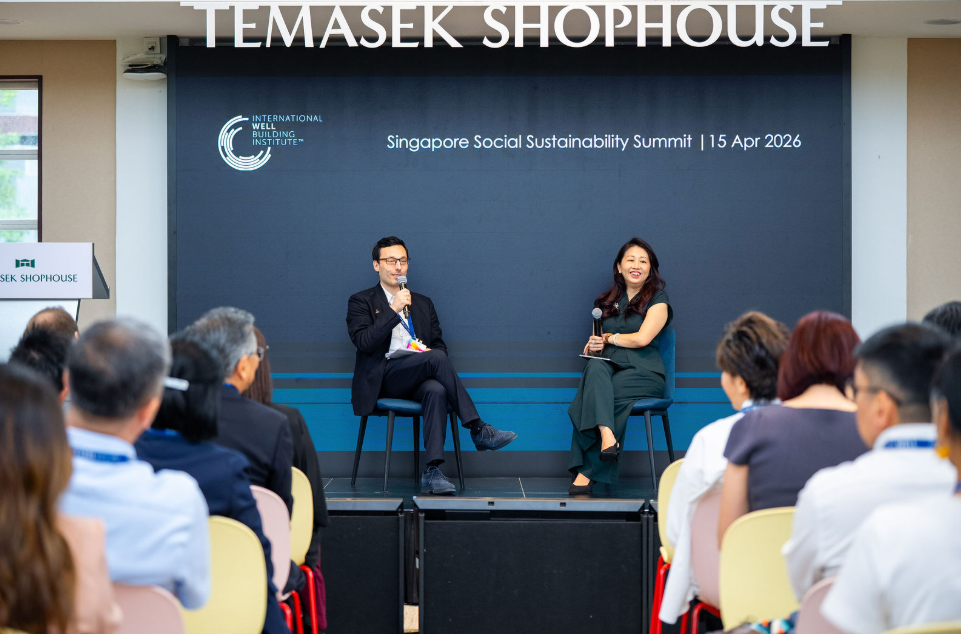
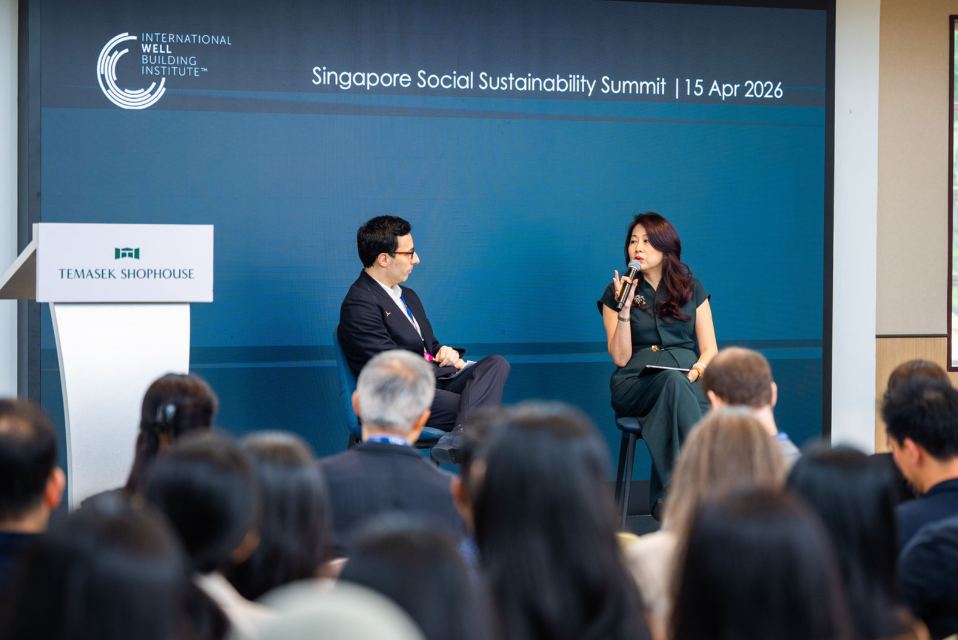
In a fireside conversation titled Building Communities Where People Thrive: A Singapore Perspective on Social Resilience & Inclusive Growth, Abigail Ng, Chief Sustainability Officer of the Monetary Authority of Singapore (MAS), joined Giovanni Cossu, Head of Sustainability at CapitaLand Development (CLD), in a moderated conversation that ranged from transition finance to the decarbonization of the built environment. Their exchange surfaced a central question increasingly relevant across the region:
How do we finance the transition to a lower-carbon economy, while ensuring workers, communities and industries are not left behind?
Ng began by grounding the audience in a simple but often overlooked reality: whether the goal is healthier buildings, stronger communities, resilient infrastructure or social impact, progress ultimately depends on capital.
“Finance underpins many of these conversations,” she noted, emphasizing that mobilizing capital at scale is what turns ambition into implementation. For an audience spanning real estate, design, policy, education and corporate leadership, it was an important reminder that social sustainability is not only a design or operational challenge, it is increasingly a capital allocation challenge as well.
As Asia continues to balance rapid economic growth, energy security and decarbonization, MAS is supporting the development of new financial solutions that move beyond emissions reductions alone, towards adaptation and resilience needs, that benefit corporates and communities.
From Carbon Credits to TRACTION
Ng began by introducing TRACTION—the Transition Credits Coalition, a multi-stakeholder initiative that MAS convened to explore how Energy Transition Credits (ETCs) can accelerate Asia’s transition toward cleaner, more resilient and diversified energy systems. ETCs are high integrity carbon credits generated from the emissions reduced from the early retirement of coal plants and its replacement with clean energy source. The proceeds from the sale of such credits can reduce the costs incurred by coal asset owners and investors from voluntarily decommissioning the coal plants early and support Just Transition efforts.
ETCs are subject to rigorous methodological guardrails and multi-stage verification processes. TRACTION recommends independent validation of a baseline retirement date, i.e. the earliest date a coal plant would have realistically closed without credit intervention, to prove additionality. ETCs are also subject to ongoing monitoring to ensure the permanent decommissioning of coal infrastructure and the verifiable replacement of that capacity with clean energy. Verification extends to the social license to operate, where project proponents provide transparent reporting on the allocation of proceeds towards Just Transition initiatives, ensuring that commitment not merely a pledge, but a verified financial flow to the affected workforce.
But in Asia, decarbonization presents a uniquely complex challenge.
A significant share of the region’s electricity still comes from coal-fired power plants—many of them relatively young assets with less than 15 years of age. Asking plant owners to shut these facilities down early is not simply an environmental decision, it is also an economic and social one.
This is where TRACTION becomes particularly relevant.
Through TRACTION, MAS and its partners are exploring how ETCs can help coal plant owners retire assets ahead of schedule while supporting a broader transition toward cleaner, more diversified energy systems.
One pilot project in the Philippines is already exploring how a coal-fired power plant could accelerate its phase-out by approximately 10 years.
A Just Transition Is Not Optional
What makes MAS’s approach particularly notable is that social impact is not treated as a secondary benefit, it is built directly into the financial design.
“Just transition actually is one of the key foundations,” Ng explained during the session.
“Coal-powered power plant industries in Asia actually employ close to 7 million people,” she noted, highlighting that the region’s energy transition is not only about assets, but about livelihoods, communities and multi-generational economic stability.
ETCs, per the crediting methodologies in the market today, can only be issued after the coal fired power plant is permanently retired and a portion of the renewable energy replacement capacity is online. According to Verra’s VCM0052 methodology, the amount of funds allocated to implement the just transition plan must exceed 2% of the expected net revenues from the sales of carbon units.
These funds can be used to support activities including:
- mitigating loss of work of individuals, businesses, and communities whose livelihoods are directly impacted by accelerated CFPP retirement
- communication and consultations, including consensus-building with the identified stakeholders
operations and management of just transition plan implementation
In other words, the energy transition cannot succeed if it is only low-carbon, it must also be fair, inclusive and economically viable.
Scaling Impact Requires More Than Good Intentions
When asked whether these models can scale across Asia, Ng was candid:
“It’s not easy, but it can be done.”
Like many breakthrough sustainability models, demonstration projects must come first. But moving from pilot to scale requires a different kind of capital.
This is where MAS sees blended finance playing a critical role.
By combining catalytic public capital, philanthropic funding, impact investment and eventually commercial financing, blended finance helps projects move through what Ng described as the “financing valley of death”, the stage where promising innovations often struggle to secure enough capital to scale.
Green Finance and the Built Environment: Connecting Capital to Lived Outcomes
The second question in the fireside chat shifted the lens from energy systems to the built environment, and asked how MAS thinks about the intersection of green finance and social outcomes.
Ms Ng highlighted that green finance must be evaluated not only by what it excludes, but by what it enables. “We want to see green loans and green bonds connecting to real outcomes for the people who live and work in these buildings, improved overall health, air quality, thermal comfort, access to green space. The financial label has to mean something on the ground,” she said.
She also drew attention to Singapore’s designation of 2026 as the Year of Adaptation, a signal that the city-state is also focusing its sustainability agenda toward resilience and adaptive capacity. In the region, there are growing adaptation and resilience needs to cope with the increasing impacts from physical climate risks which have direct consequences on infrastructure and property values, livelihoods and communities. There is a need for capital to be mobilized to finance resilience initiatives, and for MAS this is an area being explored with the financial industry.
Partnerships, Embodied Carbon and the Limits of Good Intentions
The conversation turned to one of the most intractable challenges in built environment decarbonization: embodied carbon in construction materials.
Mr Cossu acknowledged the complexity directly. “No single institution can drive a just transition alone,” he said, “and that is perhaps nowhere more true than in construction, where you have developers, contractors, material suppliers, banks and regulators all needing to move together.”
In this regard, MAS recognises that ecosystem-wide partnerships are essential. For example, industry associations like the Singapore Sustainable Finance Association (SSFA) which MAS supports, helps in connecting to the real economy through capacity-building and facilitating a credible and inclusive transition.
Asked what effective public-private partnership actually looks like on harder problems like this, Ng drew a distinction between partnerships that work and those that stall. Those that work, she argued, share three characteristics: a clear commercial rationale for each party, a shared definition of success, and early investment in building trust, before the difficult negotiations begin.
Why Common Language Matters
Capital only flows efficiently when markets speak the same language.
Ng emphasized that one of MAS’s most important roles is not just financing innovation, but creating frameworks, guidance and common reference points so that investors, banks, developers and supply chain partners can align around the same goals.
“If you have a common language, there could be a lot of friction,” she noted.
This philosophy has shaped MAS’s work on the Singapore-Asia Taxonomy, where Singapore helped pioneer the concept of transition categories, recognizing that many companies in emerging markets may not be “green” today, but need credible pathways to get there.
That pragmatic, transition-oriented approach has since attracted interest from other jurisdictions looking to develop similar frameworks.
The Next Frontier: From Environmental Transition to Human Transition
While taxonomies and transition frameworks across Asia have made important progress in defining environmental thresholds and transition pathways, the social dimension remains less systematically embedded.
That is why conversations like this matter.
As policymakers, investors and corporations increasingly focus on decarbonization, resilience and adaptation, the next frontier of sustainable finance may not simply be about reducing emissions, but about ensuring the transition strengthens livelihoods, protects communities and builds long-term social stability.
And as the region continues to grow, one thing is becoming increasingly clear:
The question is no longer whether we can finance the transition.
The question is whether we can finance a transition where people thrive.
View original content here.