Not for distribution to U.S. newswire services or for dissemination in the United States.

TORONTO, Sept. 15, 2026 (GLOBE NEWSWIRE) — Canadian Apartment Properties Real Estate Investment Trust (“CAPREIT”) (TSX: CAR.UN) announced today its September 2026 monthly distribution in the amount of $0.12917 per Unit (or $1.55 on an annualized basis). The September 2026 distribution will be payable on October 15, 2026 to Unitholders of record at the close of business on September 30, 2026.

About CAPREIT

CAPREIT is Canada’s largest publicly traded provider of quality rental housing. As at June 30, 2026, CAPREIT owns approximately 45,400 residential apartment suites and townhomes (excluding approximately 100 suites classified as assets held for sale), that are well-located across Canada and, to a lesser extent, the Netherlands, with a total fair value of approximately $14.4 billion (excluding approximately $21.6 million of assets held for sale). For more information about CAPREIT, its business and its investment highlights, please visit our website at www.capreit.ca and our public disclosures which can be found under our profile at www.sedarplus.ca.

For further information please contact:

CAPREIT
Mr. Brad Cutsey
President & Chief Executive Officer
(416) 861-9404
CAPREIT
Mr. Stephen Co
Chief Financial Officer
(416) 306-3009
 

Delisting of Common Stock Expected to Become Effective October 5, 2026

SAN JOSE, Calif., Sept. 15, 2026 (GLOBE NEWSWIRE) — zSpace, Inc. (“zSpace” or the “Company”) (OTC: ZSPC) announces its intention to voluntarily delist its common stock from The Nasdaq Stock Market LLC (“Nasdaq”) and to deregister its common stock under Section 12(b) of the Securities Exchange Act of 1934, as amended (the “Exchange Act”). The Company has provided written notice of its intention to Nasdaq and intends to file a Form 25 with the U.S. Securities and Exchange Commission (the “SEC”) on or about September 25, 2026.

As previously disclosed, on April 21, 2026, the Company received a determination from the  Listing Qualifications Department of Nasdaq to delist the Company’s common stock and trading of the Company’s common stock on Nasdaq has been suspended since April 28, 2026. On August 6, 2026, a Nasdaq Hearings Panel denied the Company’s appeal of that determination, and the period for further appeal expired on August 21, 2026. Nasdaq has not yet filed a Form 25 to complete the removal of the Company’s common stock from listing and registration. The Company’s board of directors determined to proceed with a voluntary filing in order to provide certainty as to the timing of the delisting and deregistration process.

The Company expects that the delisting of its common stock will become effective ten days after the filing of the Form 25, on or about October 5, 2026, and that the deregistration of the common stock under Section 12(b) of the Exchange Act will become effective 90 days after the filing, on or about December 24, 2026. Thereafter, the Company intends to file a Form 15 with the SEC in early January 2027 to suspend its remaining reporting obligations under the Exchange Act. Upon the filing of the Form 15, the Company’s obligations to file periodic and current reports with the SEC, including Forms 10-K, 10-Q and 8-K, will be immediately suspended. The Company reserves its right in all aspects to postpone or withdraw the above filings prior to their effectiveness; if necessary.

In reaching its determination, the board of directors considered, among other factors, that trading of the Company’s common stock on Nasdaq has been suspended since April 2026 and that the appeal process has concluded; the substantial costs, both direct and indirect, of maintaining the registration of the common stock and complying with SEC reporting requirements; the limited benefits the Company receives from continued registration in light of the suspension; and the demands that compliance places on management’s time and the Company’s resources.

The Company’s common stock is currently quoted on the OTC market under the symbol “ZSPC” and is expected to continue to be quoted following the delisting and deregistration. There can be no assurance, however, that any broker-dealer will continue to make a market in, or quote, the Company’s common stock.

The Company is posting this press release on its website at investor.zspace.com and will file a Current Report on Form 8-K with the SEC regarding the matters described above.

Forward-Looking Statements

This press release contains forward-looking statements within the meaning of the Private Securities Litigation Reform Act of 1995, including statements regarding the anticipated timing and effects of the Form 25 and Form 15 filings, the delisting and deregistration of the Company’s common stock, the suspension of the Company’s reporting obligations, and the continued quotation of the Company’s common stock on the OTC market. The words “anticipate,” “believe,” “continue,” “could,” “estimate,” “expect,” “intend,” “may,” “plan,” “potential,” “predict,” “project,” “should,” “target,” “will,” “would” and similar expressions are intended to identify forward-looking statements, although not all forward-looking statements contain these identifying words. These statements are subject to risks and uncertainties that could cause actual results to differ materially, including the timing of regulatory processes, the actions of third parties, including Nasdaq, the SEC and broker-dealers and other factors discussed in the “Risk Factors” section of the Company’s filings with the SEC. For these reasons, among others, investors are cautioned not to place undue reliance upon any forward-looking statements in this press release. Any forward-looking statements contained in this press release speak only as of the date hereof, and zSpace, Inc. specifically disclaims any obligation to update any forward-looking statement, whether as a result of new information, future events or otherwise, except as required by law.

About zSpace, Inc.

zSpace, Inc. (OTC: ZSPC) delivers innovative augmented and virtual reality (AR/VR) experiences that drive achievement in STEM, CTE, and career readiness programs. Trusted by over 3,500 school districts, technical centers, community colleges, and universities, zSpace enables hands-on “learning by doing” experiences proven to improve engagement and student outcomes. Headquartered in San Jose, California, zSpace holds more than 80 patents, with research published in the Journal of Computer Assisted Learning (2021) validating the impact of 3D virtual reality technologies on student knowledge gains.

Media:  
zSpace, Inc.  
Amanda Austin press@zspace.com 

TORONTO–(BUSINESS WIRE)–PIMCO Canada Corp. (“PIMCO Canada”) today announced the 2026 September cash distributions for the ETF series (“ETF Series”) of the PIMCO Canada mutual funds that distribute monthly (“Funds”). Unitholders of record of the ETF Series, at the close of business on September 22, 2026, will receive per-unit cash distribution payable on or about September 29, 2026. Details of the per-unit cash distribution amount are as follows: Fund Name Ticker Cash Distribution per Unit PIM

Veteran Colorado banking leader joins First Western Trust as Executive Director of Strategic Planning to support the company’s continued growth

Bill Sullivan Headshot

DENVER, Sept. 15, 2026 (GLOBE NEWSWIRE) — First Western Trust, a subsidiary of First Western Financial, Inc. (NASDAQ: MYFW), announces the appointment of Bill Sullivan as Executive Director of Strategic Planning. His decision to join First Western reflects the company’s momentum, the strength of its platform and the opportunity experienced professionals see to make a meaningful impact for clients and communities.

In this new role, Sullivan will evaluate and implement strategic growth initiatives, expand relationships across the company’s markets, support recruiting efforts and help strengthen awareness of the First Western Trust brand. He joins an established team whose expertise, commitment and client focus have helped position First Western as a differentiated financial partner for successful individuals, families and businesses across the Western United States.

“Talented professionals choose organizations where they see a compelling future, and Bill’s decision to join First Western speaks to the momentum we are building,” said Scott Wylie, Founder, Chairman and CEO of First Western Trust. “He brings deep market knowledge, strong relationships and a valuable perspective that will further strengthen the exceptional team and platform already serving our clients. We are excited to welcome him as we continue building on that foundation.”

“Bill understands both the opportunities and complexities facing successful individuals, families and businesses across our markets,” said Julie Courkamp, President and Chief Operating Officer of First Western Trust. “His experience, relationships and entrepreneurial perspective will help us translate our strategy into meaningful growth while preserving the personalized, relationship-driven approach that differentiates First Western.”

Sullivan brings nearly four decades of banking leadership, deep knowledge of the Colorado market and a strong record of building relationships with business owners and community leaders. Most recently, he spent more than a decade leading BOK Financial’s Colorado market as President and Chief Executive Officer. A former business owner himself, Sullivan understands the challenges entrepreneurs face and the role a responsive financial partner can play in helping their businesses grow, create jobs and contribute to the local economy.

“Over the past nine months, I have had the opportunity to reflect on what I wanted from my next chapter, and I could not be more pleased to join First Western Trust,” Sullivan said. “I was drawn to the company’s Colorado roots, its commitment to supporting entrepreneurs throughout the Western United States and its entrepreneurial spirit. First Western is well positioned to capitalize on the changing banking environment, and I look forward to contributing my experience and relationships to the opportunities ahead.”

As banking organizations across the industry navigate leadership change and market disruption, First Western continues to invest in its people, capabilities and client experience. The company has increasingly attracted accomplished professionals seeking a strong culture, a clear strategy and the opportunity to help clients navigate complex financial needs through an integrated approach to banking, lending and wealth management.

Sullivan has long been active in the Colorado business and nonprofit communities. He has served with the Metro Denver Economic Development Corporation, Colorado Bankers Association, Boy Scouts of America Denver Area Council and Colorado UpLift. He holds a Bachelor of Business Administration in Finance from the University of Iowa and a Master of Management in Finance from Northwestern University’s Kellogg Graduate School of Management. Outside of work, he enjoys golfing, skiing and spending time with his wife and four children.

About First Western Trust

First Western Trust partners with clients at defining moments in their financial journeys, when success brings new complexity and the path forward is not always clear. By meeting clients where they are, the firm helps guide what comes next, often addressing challenges clients may not have anticipated.

Through a personalized, holistic approach, First Western Trust integrates banking, lending and wealth management without silos, delivering thoughtful solutions and peace of mind through every stage of wealth.

Headquartered in Denver, First Western Trust serves high-net-worth individuals, families and business owners across the Western United States.

Media Contact

Nicole Zimmermann
Head of Marketing (Contract), First Western Trust
Nicole.Zimmermann@myfw.com

A photo accompanying this announcement is available at https://www.globenewswire.com/NewsRoom/AttachmentNg/1448d7d3-5600-491b-bf29-5d6ee9b516fe

Company Has Repurchased Approximately 46% of Common Shares Outstanding to Date

Charlotte, NC, Sept. 15, 2026 (GLOBE NEWSWIRE) — FG Nexus (Nasdaq: FGNX, FGNXP) (the “Company”) today announced continued progress under its previously authorized common and preferred stock repurchase programs.

Share Repurchase Programs

Through September 14, 2026, the Company has repurchased approximately 4.0 million shares of its common stock for an aggregate purchase price of approximately $48.0 million, including commissions. These repurchases represent approximately 46% of the Company’s common shares outstanding immediately before implementation of the repurchase program. As of September 14, 2026, the Company had 4,707,615 shares of common stock outstanding.

Through September 14, 2026, the Company has repurchased approximately 275,000 shares of its preferred stock for an aggregate purchase price of approximately $6.9 million, including commissions. These repurchases represent approximately 31% of the Company’s shares of preferred stock outstanding immediately before implementation of the repurchase program. As of September 14, 2026, the Company had 619,357 shares of preferred stock outstanding.

The repurchase programs remain authorized and open-ended. The timing and amount of any future repurchases will depend on market conditions, available liquidity, applicable legal requirements, the Company’s capital-allocation priorities and other considerations.

Kyle Cerminara, Chairman and Chief Executive Officer of the Company, stated: “These repurchases reflect our continued confidence in the Company’s capital-allocation strategy and our commitment to delivering long-term value to stockholders. We will continue to evaluate opportunities to return capital under both programs as we advance our broader strategic plan.”

About FG Nexus

FG Nexus (Nasdaq: FGNX, FGNXP) is a merchant bank and real estate focused operating company.

The FGNX® logo is a registered trademark.

Forward Looking Statements

This press release contains forward-looking statements within the meaning of Section 27A of the Securities Act of 1933, as amended, and Section 21E of the Securities Exchange Act of 1934, as amended. These statements are entitled to the protection of the safe-harbor provisions of those laws.

Forward-looking statements include statements concerning future share repurchases under the Company’s common and preferred stock repurchase programs, including the timing, amount and funding of any such repurchases.

These statements are based on management’s current expectations, assumptions, estimates and projections and involve risks and uncertainties, many of which are beyond the Company’s control. Actual results could differ materially from those expressed or implied by these statements.

Relevant risks include, among others, market conditions, the Company’s available liquidity, applicable legal requirements, the Company’s capital-allocation priorities and other factors that could affect the timing and amount of future repurchases.

Additional risks are described in the Company’s filings with the Securities and Exchange Commission. Forward-looking statements speak only as of the date of this release. The Company undertakes no obligation to update or revise any forward-looking statement except as required by law.

Contacts
Media Contact
media@fgnexus.io

Investor Contact
invest@fgnexus.io

– Fiscal Q4 Net Income Rebounds from Q3 to $4.6 Million –
– Adjusted EBITDA More Than Doubles Sequentially to $6.5 Million –

HOUSTON, Sept. 15, 2026 (GLOBE NEWSWIRE) — Evolution Petroleum Corporation (NYSE American: EPM) (“Evolution” or the “Company”) today announced its financial and operating results for its fiscal fourth quarter and full year ended June 30, 2026. On September 10, 2026, Evolution also declared its 17th consecutive $0.12 cash dividend per common share, payable on September 30, 2026, marking its 52nd consecutive quarterly cash dividend payment.

Financial & Operational Highlights

($ in thousands)   Q4 2026   Q4 2025   Q3 2026   % Change
Q4/Q4
  % Change
Q4/Q3
Average BOEPD     6,901       7,198     6,700     (4 ) %   3   %
Revenues   $ 24,208     $ 21,108   $ 20,168     15   %   20   %
Net Income (Loss)(1)   $ 4,614     $ 3,412   $ (8,932 )   35   %   NM  
Adjusted Net Income (Loss)(2)   $ (587 )   $ 1,129   $ (2,941 )   NM     (80 ) %
Adjusted EBITDA(3)   $ 6,522     $ 8,572   $ 3,107     (24 ) %   110   %


(1)  “NM” means “Not Meaningful.”
(2)  Adjusted Net Income is a non-GAAP financial measure; see the non-GAAP reconciliation schedules to the most comparable GAAP measures at the end of this release for more information.
(3)  Adjusted EBITDA is Adjusted Earnings Before Interest, Taxes, Depreciation, and Amortization and is a non-GAAP financial measure; see the non-GAAP reconciliation schedules to the most comparable GAAP measures at the end of this release for more information.

  • Fiscal Q4 production was 6,901 average barrels of oil equivalent per day (“BOEPD”), up 3% quarter-over-quarter, with oil accounting for 68% of revenue, natural gas accounting for 18%, and natural gas liquids (“NGLs”) accounting for 14% of revenue during the quarter.
  • Fiscal year 2026 production was 7,077 BOEPD, above 7,074 BOEPD in fiscal 2025.
  • Higher realized oil and NGL prices, together with increased production, drove a 20% increase in revenue to $24.2 million from fiscal Q3 to Q4.
  • Adjusted EBITDA more than doubled sequentially to $6.5 million from $3.1 million, while LOE per BOE improved approximately 5% to $20.35 from $21.49.
  • Returned $4.3 million to shareholders in the form of cash dividends during fiscal Q4 and $16.9 million for fiscal year 2026.
  • Ended the current year with total proved reserves of 27.2 MMBOE, compared with 27.1 MMBOE at June 30, 2025, replacing more than 100% of fiscal 2026 production of 2.6 MMBOE.

Permian/Midland Basin Mineral and Royalty Acquisition

Subsequent to quarter-end, on August 20, 2026, Evolution completed the acquisition of mineral and royalty interests (“M&R”) in the core Midland Basin (“Permian Minerals”) for approximately $16.0 million. The acquired assets include approximately 3,420 net royalty acres across Reagan, Upton, Glasscock, Midland, and Martin Counties, Texas, and included 832 producing wells, 7 completed wells, 34 drilled but uncompleted wells (“DUCs”), 27 permitted wells, and approximately 1,257 upside locations increasing our exposure to high-margin current production and future operator-led activity, with no development capital required net to Evolution. The acquisition was funded with $12.8 million of net proceeds from the Company’s concurrent public offering of 4.3 million common shares and $3.2 million of borrowings under its Senior Secured Credit Facility.

Management Comments

Kelly Loyd, President and Chief Executive Officer, commented: “Fiscal 2026 was another important year for Evolution as we broadened the portfolio with strategic acquisitions, maintained $0.48 per share in dividends, and increased proved reserves over and above the roughly 2.6 MMBOE we produced during the year. Underpinning our shareholder return strategy is the durability and continued renewal of our asset base. During the year, acquisitions and drilling activity from our non-operated and royalty assets added fresh sources of production and cash flow alongside our mature, long-life properties. Just as important, we finished the year with momentum. Many of the temporary items that weighed on fiscal Q3 rolled off as expected, and fiscal Q4 revenues rose 20% and Adjusted EBITDA more than doubled quarter over quarter.

“Continuing with the year-end momentum, we begin fiscal 2027 on a high note. We added another highly accretive acquisition, with the purchase of our Permian Minerals position, adding over 1,000 near- and long-term undeveloped drilling locations. This, combined with new operations at our recently added Louisiana minerals and royalty positions and ongoing activity across our existing portfolio of non-op working and mineral and royalty interests, fiscal 2027 is poised to benefit from fresh production adds from multiple, complementary sources.

“We continue to build Evolution into a more robust energy company with long-life producing properties and significant upside development from both our non-operated working interest assets and our recently added minerals and royalty positions. We now have meaningful mineral and royalty interests with a significant number of cost-free future drilling locations as well as attractive non-operated development locations in four of the top five most active basins in the U.S., by rig count (Permian, SCOOP/STACK, Williston, and Haynesville). This strategy of adding mineral and royalty interests creates more ways to add value and provides greater flexibility for capital allocation. We believe this combination presents a stronger model for Evolution and one we intend to keep advancing that will support our dividend and compound value for shareholders over time.”

Fiscal Fourth Quarter 2026 Financial Results

Total revenues increased 15% to $24.2 million compared to $21.1 million in the year-ago quarter. The change was driven primarily by a 20% increase in average realized equivalent prices, partially offset by a 4% decrease in average daily production.

Lease operating costs (“LOE”) increased to $12.8 million compared to $11.4 million in the year-ago quarter. The prior-year period included a $1.9 million credit from the operator of one of our Barnett Shale properties due to a joint venture audit. On a per-unit basis, as adjusted for the prior-year credit, LOE was $20.35 per BOE compared to $20.25 per BOE in the year-ago quarter.

Depletion, depreciation, and accretion expense was $5.6 million compared to $5.8 million in the year-ago period. On a per-BOE basis, the Company’s current quarter depletion rate was $8.29 per BOE, compared to $8.27 per BOE in the year-ago period.

General and administrative (“G&A”) expenses (excluding stock-based compensation) decreased to $1.8 million compared to $2.0 million in the year-ago quarter. On a per-BOE basis, G&A (excluding stock-based compensation) was $2.80 compared to $2.99 in the year-ago period.

The Company reported net income of $4.6 million, or $0.13 per diluted share, compared to $3.4 million, or $0.10 per diluted share, in the year-ago period. Higher revenues are primarily driven by increased realized pricing. Excluding the impact of selected items, which include net gains (losses) on the unrealized portion of hedges, the Company reported an adjusted net loss of $0.6 million, compared to adjusted net income of $1.1 million in the year-ago period.(1)

Adjusted EBITDA was $6.5 million compared to $8.6 million in the year-ago quarter. The decrease was primarily due to realized losses on derivative contracts in the current-year period compared to realized gains on derivative contracts in the prior-year period.(2)

Production & Pricing

Average price per unit: Q4 2026   Q4 2025   % Change Y/Y
Crude oil (BBL)   $ 90.74   $ 60.82   49   %
Natural gas (MCF)     2.13     2.76   (23 ) %
Natural Gas Liquids (BBL)     32.49     25.50   27   %
Equivalent (BOE)     38.55     32.23   20   %

Total production for the fourth quarter of fiscal 2026 decreased to 6,901 net BOEPD compared to 7,198 net BOEPD in the year-ago period. Total production for the fourth quarter of fiscal 2026 included approximately 2,000 barrels per day (“BOPD”) of crude oil, 3,791 BOEPD of natural gas, and 1,110 BOEPD of NGLs. Fiscal 2025 fourth quarter benefited from flush production from new wells brought online during that quarter. The year-over-year change in production largely reflects these wells following their expected declines over fiscal 2026. Fiscal 2026 did benefit from higher production from SCOOP/STACK, driven by the August 2025 Minerals Acquisition and new-well activity, along with a contribution from M&R interests acquired in the Haynesville and Bossier shale in Louisiana.

The Company’s average realized commodity price (excluding the impact of derivative contracts) increased 20% to $38.55 per BOE in fiscal Q4, compared to $32.23 per BOE in the year-ago period.

Operations Update

At SCOOP/STACK, Evolution continued to benefit from its combination of working interests and M&R interests. Production remained strong while operating costs improved, reflecting the growing contribution from the minerals and royalty portfolio. Fiscal Q4 production averaged 1,275 BOEPD, up about 14% from the prior-year quarter, while LOE declined to $10.33 per BOE from $11.05 in the prior-year quarter. Third-party operators remain active around the Company’s acreage, providing continued development visibility, with ten gross working-interest wells brought online in fiscal 2026, and approximately ten already expected to be brought online in fiscal 2027 so far. During the year, across our combined SCOOP/STACK portfolio (working interests and M&R interests), our operators brought online 31 gross wells. As of July 31st, we have an interest in 725 gross producing wells, 36 gross wells that have either been identified as Proved Undeveloped (“PUDs”) or are already in various stages of drilling and completion, and over 360 additional gross locations.

(1)  Adjusted net income (loss) is a non-GAAP financial measure; see the non-GAAP reconciliation schedules to the most comparable GAAP measures at the end of this release for more information.
(2)  Adjusted EBITDA is Adjusted Earnings Before Interest, Taxes, Depreciation, and Amortization and is a non-GAAP financial measure; see the non-GAAP reconciliation schedules to the most comparable GAAP measures at the end of this release for more information.

In Louisiana, operator activity across the Haynesville and Bossier positions continues to progress, with wells moving through various stages of development and into production. As of July 31st, the portfolio included approximately 90 producing gross wells, 16 wells in various stages of drilling or completion, 35 pre-permitted wells, and over 60 additional identified gross locations.

Operating performance at our TexMex assets in Louisiana, Texas and New Mexico continued to improve during the fiscal fourth quarter as workover and optimization activity progressed. The operator continues to identify opportunities to restore and enhance production from the existing well base, and the Company expects the TexMex assets to be an important contributor to the overall cash flow as those efforts continue.

At Chaveroo, production increased meaningfully during fiscal 2026, benefiting from a full year of production from the wells brought online during the fourth quarter of fiscal 2025. Average production increased to approximately 260 BOEPD from 175 BOEPD in fiscal 2025. The Company has secured six drilling permits and is in discussions with its partner regarding the timing of future drilling.

Across the Company’s legacy assets, the focus remains on maintaining base production, improving operating reliability, and pursuing selective drilling and workover opportunities. Operational issues that affected several properties earlier in fiscal 2026 improved as the year progressed.

Balance Sheet, Liquidity, and Capital Spending

On June 30, 2026, the Company had cash and cash equivalents of $6.1 million, outstanding borrowings of $56.5 million, and $0.8 million in letters of credit outstanding under its Senior Secured Credit Facility, and a weighted average interest rate of 6.69%. Availability under the facility was $7.7 million, bringing total liquidity to $13.9 million. In the fourth quarter of fiscal 2026, Evolution paid $4.3 million in common stock dividends, $1.7 million for minerals acquisitions, and incurred $1.5 million in capital expenditures. These cash outlays were partially offset by cash received of $3.1 million from its SCOOP/STACK non-core, non-producing mineral acreage divestiture. Evolution also received net proceeds of $1.0 million, net of $0.1 million of offering costs paid, from the sale of shares of common stock under its At-The-Market equity sales agreement. The Company had total net cash provided by operating activities of $6.8 million for the quarter.

On August 20, 2026, Evolution entered into a letter agreement with MidFirst Bank pursuant to which the borrowing base on the Company’s Senior Secured Credit Facility was temporarily increased from $65.0 million to $73.0 million from August 20, 2026 until October 20, 2026, unless redetermined earlier in accordance with the credit agreement. Pro forma for the Permian Minerals acquisition, after taking into account the common stock offering in August 2026, additional net borrowings of $3.2 million under our Senior Secured Credit Facility, and the temporary increase in the Company’s revolving borrowing base, Evolution had 40.2 million shares of common stock outstanding and total liquidity of approximately $19 million.

Cash Dividend on Common Stock

On September 10, 2026, Evolution’s Board of Directors declared a cash dividend of $0.12 per share of common stock, payable on September 30, 2026, to common stockholders of record on September 21, 2026. This will be the 52nd consecutive quarterly cash dividend on the Company’s common stock since December 31, 2013. To date, Evolution has returned approximately $151.7 million, or $4.53 per share, back to stockholders in common stock dividends.

Conference Call

As previously announced, Evolution Petroleum will host a conference call on Wednesday, September 16, 2026, at 10:00 a.m. CT to review its fiscal fourth quarter 2026 financial and operating results. Participants can join online at https://event.choruscall.com/mediaframe/webcast.html?webcastid=ai980iXu or by dialing (844) 481-2813. Dial-in participants should ask to join the Evolution Petroleum Corporation call. A replay will be available through September 15, 2027, via the provided webcast link and on Evolution’s Investor Relations website at www.ir.evolutionpetroleum.com.

About Evolution Petroleum

Evolution Petroleum Corporation is an independent energy company focused on maximizing total shareholder returns through the ownership of and investment in working and royalty interests in onshore oil and natural gas properties in the U.S. The Company aims to build and maintain a diversified portfolio of long-life oil and natural gas properties through acquisitions, selective development opportunities, production enhancements, and other exploitation efforts. Visit www.evolutionpetroleum.com for more information.

Cautionary Statement

All forward-looking statements contained in this press release regarding the Company’s current and future expectations, potential results, and plans and objectives involve a wide range of risks and uncertainties. Statements herein using words such as “anticipate,” “believe,” “expect,” “may,” “plans,” “outlook,” “should,” “will,” and words of similar meaning are forward-looking statements. Although the Company’s expectations are based on business, engineering, geological, financial, and operating assumptions that it believes to be reasonable, many factors could cause actual results to differ materially from its expectations. The Company gives no assurance that its goals will be achieved. These factors and others are detailed under the heading “Risk Factors” and elsewhere in our periodic reports filed with the Securities and Exchange Commission (“SEC”). The Company undertakes no obligation to update any forward-looking statement.

Contact

Investor Relations
(713) 935-0122
ir@evolutionpetroleum.com

Evolution Petroleum Corporation
Proved Reserves as of June 30, 2026

Our proved reserves as of June 30, 2026, were estimated by our independent reservoir engineers, Cawley, Gillespie and Associates, Inc. and DeGolyer and MacNaughton, both worldwide petroleum consultants.

The SEC sets rules related to reserve estimation and disclosure requirements for oil and natural gas companies. These rules require disclosure of oil and natural gas proved reserves by significant geographic area, using the trailing 12-month average price, calculated as the unweighted arithmetic average of the first-day-of-the-month price for each month within the 12-month period prior to the end of the reporting period, rather than year-end prices, and allows the use of new technologies in the determination of proved reserves if those technologies have been demonstrated empirically to lead to reliable conclusions about reserve volumes. Subject to limited exceptions, the rules also require that proved undeveloped reserves may only be classified as such if a development plan has been adopted indicating that they are scheduled to be drilled within five years.

For more information on the Company’s reserves, see our Supplemental Disclosure about Oil and Natural Gas Properties included on Form 10-K filed with the SEC for the year ended June 30, 2026.

                 
    Oil   Natural Gas   NGLs   Total Proved Reserves
Reserve Category   (MBbls)   (MMcf)   (MBbls)   (MBOE)
Proved Developed Producing   7,049   67,400   3,750   22,032
Proved Non-Producing   301   259   5   349
Proved Undeveloped   3,275   6,533   472   4,836
Total Proved   10,625   74,192   4,227   27,217

                 
    Oil   Natural Gas   NGLs   Total Proved Reserves
Asset   (MBbls)   (MMcf)   (MBbls)   (MBOE)
SCOOP/STACK   1,325   15,080   1,112   4,950
Chaveroo Field   2,714   877   187   3,047
Jonah Field   181   18,484   238   3,500
Williston Basin   1,674   1,337   332   2,229
Barnett Shale   73   29,366   1,738   6,705
Hamilton Dome Field   1,684   —   —   1,684
Delhi Field   1,658   —   620   2,278
TexMex and Other   1,316   9,048   —   2,824
Total Proved   10,625   74,192   4,227   27,217

Evolution Petroleum Corporation
Condensed Consolidated Statements of Operations (Unaudited)
(In thousands, except per share amounts)
 
    Three Months Ended   Years Ended
    June 30,   March 31,   June 30,
    2026     2025     2026     2026     2025  
Revenues                              
Crude oil   $ 16,514     $ 12,833     $ 10,474     $ 50,556     $ 51,102  
Natural gas     4,413       5,648       7,284       25,038       23,516  
Natural gas liquids     3,281       2,627       2,410       10,749       11,222  
Total revenues     24,208       21,108       20,168       86,343       85,840  
Operating costs                              
Lease operating costs     12,782       11,367       12,959       50,338       49,338  
Depletion, depreciation, and accretion     5,606       5,821       5,294       22,780       21,993  
General and administrative expenses     2,355       2,580       2,473       9,745       10,334  
Total operating costs     20,743       19,768       20,726       82,863       81,665  
Income (loss) from operations     3,465       1,340       (558 )     3,480       4,175  
Other income (expense)                              
Net gain (loss) on derivative contracts     2,603       3,696       (9,869 )     (2,850 )     473  
Interest and other income     26       27       24       72       191  
Interest expense     (969 )     (678 )     (960 )     (3,849 )     (2,970 )
Income (loss) before income taxes     5,125       4,385       (11,363 )     (3,147 )     1,869  
Income tax (expense) benefit     (511 )     (973 )     2,431       718       (396 )
Net income (loss)   $ 4,614     $ 3,412     $ (8,932 )   $ (2,429 )   $ 1,473  
Net income (loss) per common share:                              
Basic   $ 0.13     $ 0.10     $ (0.26 )   $ (0.08 )   $ 0.03  
Diluted   $ 0.13     $ 0.10     $ (0.26 )   $ (0.08 )   $ 0.03  
Weighted average number of common shares outstanding:                              
Basic     35,070       33,553       34,315       34,251       33,158  
Diluted     35,262       33,723       34,315       34,251       33,323  

Evolution Petroleum Corporation
Condensed Consolidated Balance Sheets (Unaudited)
(In thousands, except share and per share amounts)
 
    June 30, 2026   June 30, 2025
Assets            
Current assets            
Cash and cash equivalents   $ 6,137   $ 2,507
Receivables from crude oil, natural gas, and natural gas liquids revenues     10,089     10,804
Derivative contract assets     2,094     1,777
Prepaid expenses and other current assets     2,199     2,287
Total current assets     20,519     17,375
Property and equipment, net of depletion, depreciation, and impairment            
Oil and natural gas properties, net — full-cost method of accounting, of which none were excluded from amortization     146,967     142,248
             
Other noncurrent assets            
Derivative contract assets     478     198
Other assets, net     734     431
Total assets   $ 168,698   $ 160,252
Liabilities and Stockholders’ Equity            
Current liabilities            
Accounts payable   $ 13,817   $ 12,901
Accrued liabilities and other     5,674     6,909
Derivative contract liabilities     2,865     1,577
Total current liabilities     22,356     21,387
Long term liabilities            
Senior secured credit facility     56,500     37,500
Deferred income taxes     5,271     6,234
Asset retirement obligations     23,626     21,535
Derivative contract liabilities     190     1,783
Operating lease liability     351     —
Total liabilities     108,294     88,439
Commitments and contingencies            
Stockholders’ equity            
Common stock; par value $0.001; 100,000,000 shares authorized: issued and            
outstanding 35,949,843 and 34,337,188 shares as of June 30, 2026            
and 2025, respectively     36     34
Additional paid-in capital     54,611     46,650
Retained earnings     5,757     25,129
Total stockholders’ equity     60,404     71,813
Total liabilities and stockholders’ equity   $ 168,698   $ 160,252

Evolution Petroleum Corporation
Condensed Consolidated Statements of Cash Flows (Unaudited)
(In thousands)
 
    Three Months Ended   Years Ended
    June 30,   March 31,   June 30,
    2026     2025     2026     2026     2025  
Cash flows from operating activities:                              
Net income (loss)   $ 4,614     $ 3,412     $ (8,932 )   $ (2,429 )   $ 1,473  
Adjustments to reconcile net income (loss) to net cash provided by operating activities:                              
Depletion, depreciation, and accretion     5,606       5,821       5,294       22,780       21,993  
Stock-based compensation     599       622       595       2,344       2,482  
Settlement of asset retirement obligations     (15 )     (39 )     (51 )     (246 )     (385 )
Deferred income taxes     1,442       1,662       (1,106 )     (963 )     (468 )
Unrealized (gain) loss on derivative contracts     (5,777 )     (2,934 )     7,621       (902 )     492  
Accrued settlements on derivative contracts     (47 )     (137 )     688       631       (251 )
Amortization of debt issuance costs     39       —       39       156       —  
Other     25       (1 )     7       24       (8 )
Changes in operating assets and liabilities:                              
Receivables from crude oil, natural gas, and natural gas liquids revenues     (403 )     109       74       1,180       75  
Prepaid expenses and other current assets     (214 )     1,525       (1,120 )     25       2,925  
Accounts payable and accrued liabilities and other     1,355       416       1,227       918       4,798  
State and federal taxes payable     (425 )     —       (847 )     —       (74 )
Net cash provided by operating activities     6,799       10,456       3,489       23,518       33,052  
Cash flows from investing activities:                              
Acquisitions of oil and natural gas properties     (1,680 )     (6,868 )     (4,662 )     (22,988 )     (9,019 )
Proceeds from the sale of unproved oil and natural gas properties     3,093       —       —       3,093       —  
Capital expenditures for oil and natural gas properties     (1,360 )     (4,721 )     (1,263 )     (7,280 )     (12,623 )
Net cash used in investing activities     53       (11,589 )     (5,925 )     (27,175 )     (21,642 )
Cash flows from financing activities:                              
Common stock dividends paid     (4,330 )     (4,123 )     (4,261 )     (16,943 )     (16,347 )
Common stock repurchases, including stock surrendered for tax withholding     —       (180 )     (43 )     (225 )     (442 )
Borrowings under senior secured credit facility     —       2,000       2,000       22,000       2,000  
Repayments of senior secured credit facility     —       —       —       (3,000 )     (4,000 )
Debt issuance costs     —       (90 )     —       (379 )     (90 )
Issuance of common stock     1,126       436       3,672       6,070       3,840  
Offering costs     (127 )     (4 )     (78 )     (236 )     (310 )
Net cash provided by (used in) financing activities     (3,331 )     (1,961 )     1,290       7,287       (15,349 )
Net increase (decrease) in cash and cash equivalents     3,521       (3,094 )     (1,146 )     3,630       (3,939 )
Cash and cash equivalents, beginning of period     2,616       5,601       3,762       2,507       6,446  
Cash and cash equivalents, end of period   $ 6,137     $ 2,507     $ 2,616     $ 6,137     $ 2,507  


Evolution Petroleum Corporation
Non-GAAP Reconciliation – Adjusted EBITDA (Unaudited)
(In thousands)

Adjusted EBITDA and Net income (loss) and earnings per share excluding selected items are non-GAAP financial measures that are used as supplemental financial measures by our management and by external users of our financial statements, such as investors, commercial banks, and others, to assess our operating performance as compared to that of other companies in our industry, without regard to financing methods, capital structure, or historical costs basis. We use these measures to assess our ability to incur and service debt and fund capital expenditures. Our Adjusted EBITDA and Net income (loss) and earnings per share, excluding selected items, should not be considered alternatives to net income (loss), operating income (loss), cash flows provided by (used in) operating activities, or any other measure of financial performance or liquidity presented in accordance with U.S. GAAP. Our Adjusted EBITDA and Net income (loss) and earnings per share excluding selected items may not be comparable to similarly titled measures of another company because all companies may not calculate Adjusted EBITDA and Net income (loss) and earnings per share excluding selected items in the same manner.

We define Adjusted EBITDA as net income (loss) plus interest expense, income tax expense (benefit), depreciation, depletion, and accretion (DD&A), stock-based compensation, ceiling test impairment, and other impairments, unrealized loss (gain) on change in fair value of derivatives, and other non-recurring or non-cash expense (income) items.

    Three Months Ended   Years Ended
    June 30,   March 31,   June 30,
    2026     2025     2026     2026     2025
Net income (loss)   $ 4,614     $ 3,412     $ (8,932 )   $ (2,429 )   $ 1,473
Adjusted by:                              
Interest expense     969       678       960       3,849       2,970
Income tax expense (benefit)     511       973       (2,431 )     (718 )     396
Depletion, depreciation, and accretion     5,606       5,821       5,294       22,780       21,993
Stock-based compensation     599       622       595       2,344       2,482
Unrealized loss (gain) on derivative contracts     (5,777 )     (2,934 )     7,621       (902 )     492
Adjusted EBITDA   $ 6,522     $ 8,572     $ 3,107     $ 24,924     $ 29,806

Evolution Petroleum Corporation
Non-GAAP Reconciliation – Adjusted Net Income (Unaudited)
(In thousands, except per share amounts)
 
    Three Months Ended   Years Ended
    June 30,   March 31,   June 30,
    2026     2025     2026     2026     2025  
As Reported:                              
Net income (loss), as reported   $ 4,614     $ 3,412     $ (8,932 )   $ (2,429 )   $ 1,473  
                               
Impact of Selected Items:                              
Unrealized loss (gain) on commodity contracts     (5,777 )     (2,934 )     7,621       (902 )     492  
Selected items, before income taxes   $ (5,777 )   $ (2,934 )   $ 7,621     $ (902 )   $ 492  
Income tax effect of selected items(1)     (576 )     (651 )     1,630       (206 )     104  
Selected items, net of tax   $ (5,201 )   $ (2,283 )   $ 5,991     $ (696 )   $ 388  
                               
As Adjusted:                              
Net income (loss), excluding selected items(2)   $ (587 )   $ 1,129     $ (2,941 )   $ (3,125 )   $ 1,861  
                               
Undistributed earnings allocated to unvested restricted stock     (103 )     (93 )     (105 )     (393 )     (367 )
Net income (loss), excluding selected items for earnings per share calculation   $ (690 )   $ 1,036     $ (3,046 )   $ (3,518 )   $ 1,494  
                               
Net income (loss) per common share — Basic, as reported   $ 0.13     $ 0.10     $ (0.26 )   $ (0.08 )   $ 0.03  
Impact of selected items     (0.15 )     (0.07 )     0.17       (0.02 )     0.02  
Net income (loss) per common share — Basic, excluding selected items(2)   $ (0.02 )   $ 0.03     $ (0.09 )   $ (0.10 )   $ 0.05  
                               
                               
Net income (loss) per common share — Diluted, as reported   $ 0.13     $ 0.10     $ (0.26 )   $ (0.08 )   $ 0.03  
Impact of selected items     (0.15 )     (0.07 )     0.17       (0.02 )     0.01  
Net income (loss) per common share — Diluted, excluding selected items(2)(3)   $ (0.02 )   $ 0.03     $ (0.09 )   $ (0.10 )   $ 0.04  


(1)  The tax impact for the three months ended June 30, 2026 and 2025, is represented using estimated tax rates of 10.0% and 22.2%, respectively. The tax impact for the three months ended March 31, 2026, is represented using estimated tax rates of 21.4%. The tax impact for the years ended June 30, 2026 and 2025, is represented using estimated tax rates of 22.8% and 21.2%, respectively.
(2)  Net income (loss) and earnings per share excluding selected items are non-GAAP financial measures presented as supplemental financial measures to enable a user of the financial information to understand the impact of these items on reported results. These financial measures should not be considered an alternative to net income (loss), operating income (loss), cash flows provided by (used in) operating activities, or any other measure of financial performance or liquidity presented in accordance with U.S. GAAP. Our Adjusted Net Income (Loss) and earnings per share may not be comparable to similarly titled measures of another company because all companies may not calculate Adjusted Net Income (Loss) and earnings per share in the same manner.
(3)  The impact of selected items for the three months ended June 30, 2026 and 2025, were each calculated based upon weighted average diluted shares of 35.1 million and 33.7 million, respectively, due to the net income (loss), excluding selected items. The impact of selected items for the three months ended March 31, 2026, was calculated based upon weighted average diluted shares of 34.3 million due to the net income (loss), excluding selected items. The impact of selected items for the years ended June 30, 2026 and 2025, were each calculated based upon weighted average diluted shares of 34.3 million and 33.3 million, respectively, due to the net income (loss), excluding selected items.

Evolution Petroleum Corporation
Supplemental Information on Oil and Natural Gas Operations (Unaudited)
(In thousands, except per unit and per BOE amounts)
 
    Three Months Ended   Years Ended
    June 30,    March 31,    June 30, 
    2026   2025      2026   2026   2025
Revenues:                              
Crude oil   $ 16,514   $ 12,833   $ 10,474   $ 50,556   $ 51,102
Natural gas     4,413     5,648     7,284     25,038     23,516
Natural gas liquids     3,281     2,627     2,410     10,749     11,222
Total revenues   $ 24,208   $ 21,108   $ 20,168   $ 86,343   $ 85,840
                               
Lease operating costs:                              
Ad valorem and production taxes   $ 1,438   $ 1,381   $ 1,317   $ 4,763   $ 5,709
Gathering, transportation, and other costs     2,746     2,765     2,834     11,139     11,357
Other lease operating costs     8,598     7,221     8,808     34,436     32,272
Total lease operating costs   $ 12,782   $ 11,367   $ 12,959   $ 50,338   $ 49,338
                               
Depletion of full cost proved oil and natural gas properties   $ 5,205   $ 5,418   $ 4,900   $ 21,197   $ 20,374
                               
Production:                              
Crude oil (MBBL)     182     211     177     759     766
Natural gas (MMCF)     2,069     2,045     1,968     8,428     8,409
Natural gas liquids (MBBL)     101     103     98     419     414
Equivalent (MBOE)(1)     628     655     603     2,583     2,582
Average daily production (BOEPD)(1)     6,901     7,198     6,700     7,077     7,074
                               
Average price per unit(2):                              
Crude oil (BBL)   $ 90.74   $ 60.82   $ 59.18   $ 66.61   $ 66.71
Natural gas (MCF)     2.13     2.76     3.70     2.97     2.80
Natural Gas Liquids (BBL)     32.49     25.50     24.59     25.65     27.11
Equivalent (BOE)(1)   $ 38.55   $ 32.23   $ 33.45   $ 33.43   $ 33.25
                               
Average cost per unit:                              
Ad valorem and production taxes   $ 2.29   $ 2.11   $ 2.18   $ 1.84   $ 2.21
Gathering, transportation, and other costs     4.37     4.22     4.70     4.31     4.40
Other lease operating costs     13.69     11.02     14.61     13.33     12.50
Total lease operating costs   $ 20.35   $ 17.35   $ 21.49   $ 19.48   $ 19.11
                               
Depletion of full cost proved oil and natural gas properties   $ 8.29   $ 8.27   $ 8.13   $ 8.21   $ 7.89


(1)  Equivalent oil reserves are defined as six MCF of natural gas and 42 gallons of NGLs to one barrel of oil conversion ratio, which reflects energy equivalence and not price equivalence. Natural gas prices per MCF and NGL prices per barrel often differ significantly from the equivalent amount of oil.
(2)  Amounts exclude the impact of cash paid or received on the settlement of derivative contracts since we did not elect to apply hedge accounting.

Evolution Petroleum Corporation
Summary of Production Volumes and Average Sales Price (Unaudited)
 
    Three Months Ended
    June 30,   March 31,
    2026   2025   2026
    Volume   Price   Volume   Price   Volume   Price
Production:                                    
Crude oil (MBBL)                                    
SCOOP/STACK     28   $ 98.33     32   $ 64.15     27   $ 69.24
Chaveroo Field     20     92.98     30     58.47     20     63.87
Jonah Field     6     86.28     6     59.83     6     63.70
Williston Basin     29     93.70     33     56.39     28     64.57
Barnett Shale     2     91.58     2     59.14     2     66.12
Hamilton Dome Field     33     77.51     34     52.99     32     57.23
Delhi Field     49     91.82     56     67.03     43     43.24
Other     15     94.28     18     63.66     19     70.28
Total     182   $ 90.74     211   $ 60.82     177   $ 59.18
Natural gas (MMCF)                                    
SCOOP/STACK     358   $ 3.23     312   $ 3.20     389   $ 4.13
Jonah Field     688     1.23     691     2.49     675     3.45
Williston Basin     25     3.22     26     2.17     24     3.28
Barnett Shale     853     2.33     945     2.84     801     3.87
TexMex and Other     145     2.36     71     2.64     79     2.19
Total     2,069   $ 2.13     2,045   $ 2.76     1,968   $ 3.70
Natural gas liquids (MBBL)                                    
SCOOP/STACK     28   $ 29.33     18   $ 23.27     27   $ 19.01
Jonah Field     7     33.15     8     26.84     8     25.50
Williston Basin     6     22.96     7     18.34     7     18.47
Barnett Shale     50     32.59     53     26.77     47     28.49
Delhi Field     10     47.56     17     25.66     9     23.36
Total     101   $ 32.49     103   $ 25.50     98   $ 24.59
                                     
Equivalent (MBOE)(1)                                    
SCOOP/STACK     116   $ 40.64     102   $ 34.10     119   $ 33.66
Chaveroo Field     20     92.98     30     58.47     20     63.87
Jonah Field     128     12.85     129     17.91     127     23.12
Williston Basin     39     75.77     44     46.33     39     52.02
Barnett Shale     194     19.54     213     19.95     183     25.09
Hamilton Dome Field     33     77.51     34     52.99     32     57.23
Delhi Field     59     84.55     73     57.27     52     39.44
TexMex and Other     39     44.39     30     43.95     31     45.49
Total     628   $ 38.55     655   $ 32.23     603   $ 33.45
                                     
Average daily production (BOEPD)(1)                                    
SCOOP/STACK     1,275           1,121           1,322      
Chaveroo Field     220           330           222      
Jonah Field     1,407           1,418           1,411      
Williston Basin     429           484           433      
Barnett Shale     2,132           2,341           2,033      
Hamilton Dome Field     363           374           356      
Delhi Field     648           802           578      
TexMex and Other     427           328           345      
Total     6,901           7,198           6,700      


(1)  Equivalent oil reserves are defined as six MCF of natural gas and 42 gallons of NGLs to one barrel of oil conversion ratio, which reflects energy equivalence and not price equivalence. Natural gas prices per MCF and NGL prices per barrel often differ significantly from the equivalent amount of oil.

Evolution Petroleum Corporation
Summary of Average Production Costs (Unaudited)
 
    Three Months Ended
    June 30,   March 31,
Production costs (in thousands, except per BOE):   2026   2025   2026
Total lease operating costs(1)   Amount   per BOE   Amount   per BOE   Amount   per BOE
SCOOP/STACK   $ 1,196   $ 10.33   $ 1,130   $ 11.05   $ 1,064   $ 8.96
Chaveroo Field     338     16.90     501     16.65     320     15.92
Jonah Field     1,737     13.53     1,928     14.91     2,047     16.21
Williston Basin     1,249     31.88     1,159     26.48     1,162     30.09
Barnett Shale(2)     3,512     18.11     1,850     8.67     3,747     20.49
Hamilton Dome Field     1,422     43.12     1,523     44.36     1,226     37.73
Delhi Field     1,710     29.18     2,087     28.73     1,836     34.13
TexMex and Other     1,618     41.57     1,189     41.47     1,557     57.61
Total   $ 12,782   $ 20.35   $ 11,367   $ 17.35   $ 12,959   $ 21.49


(1)  Total lease operating costs includes lifting costs; workover expenses; and gathering, transportation, processing and other expenses.
(2)  Barnett Shale lease operating costs for the three months ended June 30, 2025, contains a $1.9 million credit from one of our operators due to a joint venture audit.

Evolution Petroleum Corporation
Summary of Open Derivative Contracts (Unaudited)

For more information on the Company’s hedging practices, see Note 7 to its financial statements included on Form 10-K filed with the SEC for the year ended June 30, 2026.

The Company has the following open crude oil and natural gas derivative contracts:

            Volumes in   Weighted Average Price per MMBTU/BBL
Period   Commodity   Instrument   MMBTU/BBL   Swap   Sub Floor   Floor   Ceiling
July 2026 – September 2026   Crude Oil   Fixed-Price
Swap
  43,870   $ 60.77                  
January 2027 – December 2027   Crude Oil   Fixed-Price
Swap
  199,662     68.43                  
July 2026 – December 2026   Crude Oil   Two-Way Collar   121,892               $ 63.28   $ 73.26
January 2027 – December 2027   Crude Oil   Two-Way Collar   273,839                 62.28     74.57
September 2026 – December 2026   Crude Oil   Three-Way
Collar
  67,002         $ 50.00     58.83     70.36
July 2026 – December 2026   Natural Gas   Fixed-Price
Swap
  1,745,693     3.63                  
January 2027 – December 2027   Natural Gas   Fixed-Price
Swap
  1,946,285     3.41                  
July 2026 – December 2026   Natural Gas   Two-Way Collar   1,177,472                 3.57     4.71
January 2027 – June 2027   Natural Gas   Two-Way Collar   1,235,604                 3.27     4.92

This press release was published by a CLEAR® Verified individual.

NEW YORK and WASHINGTON, Sept. 15, 2026 (GLOBE NEWSWIRE) — Royalty Pharma and Blood Cancer United today announced a $7.5 million donation from Royalty Pharma to support Blood Cancer United’s Therapy Acceleration Program (TAP), a collaborative venture philanthropy initiative designed to accelerate the development of promising blood cancer therapies through strategic equity investments and hands-on collaboration with biotech companies.

The donation marks a new phase for TAP, with Royalty Pharma serving as the first and largest corporate donor under an updated model that invites direct donations to the program. TAP donations are deployed as venture capital investments in early-stage biotech companies advancing therapies with high potential to address significant unmet needs in blood cancer. In addition to providing critical funding, TAP offers scientific, clinical and business expertise, strategic guidance and access to a global network of blood cancer experts to help bring new therapies closer to patients.

TAP is designed to generate outcomes aligned with Blood Cancer United’s mission, including positive clinical trial results, regulatory approvals, and new treatment options for patients. Financial returns from TAP are reinvested into the program to support future partnerships and investments, extending the impact of donor support and helping accelerate the development of future blood cancer therapies.

“For nearly 30 years, Royalty Pharma has invested in scientific and medical innovation, including many important advances in blood cancer,” said Pablo Legorreta, Chief Executive Officer and Chairman of the Board of Royalty Pharma. “We believe that scientific discovery can only transform patients’ lives when it is successfully translated into medicines. This gift reflects both our longstanding commitment to advancing blood cancer innovation and our confidence in Blood Cancer United’s ability to help promising therapies move closer to patients.”

This donation builds on a collaborative partnership between Blood Cancer United and Royalty Pharma. In 2022, Royalty Pharma launched a five-year, $7.5 million alliance with the organization focused on addressing healthcare disparities in blood cancer care and treatment, including expanding access to clinical trials for underserved patients. The new gift expands that relationship with a shared commitment to drive the next generation of blood cancer therapies to patients.

“As scientific advances create new possibilities for patients, many promising therapies still fail to reach patients,” said Dr. E. Anders Kolb, president and CEO of Blood Cancer United. “TAP helps move those therapies forward by supporting companies at a critical stage of development where funding and expertise can determine whether a therapy advances or stalls. This gift from Royalty Pharma will help us continue to advance science, create new treatment options, and ultimately improve outcomes for people with blood cancer.”

Watch Dr. Kolb discuss this milestone for TAP.

“It takes a lot of determination and smart people, along with a fair amount of good fortune and investors, of course, to develop new treatments, especially for rare diseases,” said Troy Wilson, Ph.D., JD, president, CEO and co-founder of Kura Oncology. “TAP and Royalty Pharma are a formidable pairing that combines all of that. Above all, they share our conviction that patients must remain at the center of every decision we make.”

TAP and Blood Cancer United provided early, critical support for foundational work conducted at the University of Michigan and played a key role in introducing that work to Kura Oncology. Kura then advanced the development of ziftomenib, a member of a new class of drugs known as menin inhibitors. Ziftomenib is now FDA-approved as a targeted therapy for adults with relapsed or refractory acute myeloid leukemia with a susceptible NPM1 mutation.

Royalty Pharma’s commitment is part of a broader effort by a group of inaugural funders supporting this next phase of TAP. Blood Cancer UK also contributed $1 million to the program, and Blood Cancer United committed $15 million to support TAP’s continued growth.

About Royalty Pharma plc 

Founded in 1996, Royalty Pharma is the largest buyer of biopharmaceutical royalties and a leading funder of innovation across the biopharmaceutical industry, collaborating with innovators from academic institutions, research hospitals and non-profits through small and mid-cap biotechnology companies to leading global pharmaceutical companies. Royalty Pharma has assembled a portfolio of royalties which entitles it to payments based directly on the top-line sales of many of the industry’s leading therapies. Royalty Pharma funds innovation in the biopharmaceutical industry both directly and indirectly – directly when it partners with companies to co-fund late-stage clinical trials and new product launches in exchange for future royalties, and indirectly when it acquires existing royalties from the original innovators. Royalty Pharma’s current portfolio includes royalties on more than 35 commercial products, including Vertex’s Trikafta and Alyftrek, GSK’s Trelegy, Roche’s Evrysdi, Johnson & Johnson’s Tremfya, Biogen’s Tysabri and Spinraza, Servier’s Voranigo, AbbVie and Johnson & Johnson’s Imbruvica, Astellas and Pfizer’s Xtandi, Pfizer’s Nurtec ODT, and Gilead’s Trodelvy, and 17 development-stage product candidates. For more information, visit www.royaltypharma.com.

About Blood Cancer United®

Blood Cancer United® (formerly The Leukemia & Lymphoma Society) is the largest global nonprofit focused on blood cancer patient support, research, and advocacy. Since their founding in 1949, the organization has consistently evolved to better serve people affected by all 100-plus types of blood cancer. Blood Cancer United funds innovative research, offers free resources and personalized support, and advocates at state and national levels for more accessible and affordable healthcare for all patients. To learn more, visit www.BloodCancerUnited.org. 

About Therapy Acceleration Program

The Therapy Acceleration Program® is Blood Cancer United’s mission-driven, strategic venture philanthropy initiative that seeks to accelerate the development of innovative blood cancer therapies and change the standard of care.

TAP collaborates with biotech companies to support the development of novel platforms, first-in-class therapies addressing high unmet medical needs, emerging patient populations, and orphan indications. 

Founded in 2007, TAP was created to help move promising blood cancer therapies into clinical development faster. As it approaches its 20th year, the program continues to provide funding and scientific, clinical and drug development expertise to advance therapies at critical stages of development to address unmet medical needs.

Since its launch, TAP has supported six therapies that have gone on to receive U.S. Food and Drug Administration approval or be included in the National Comprehensive Cancer Network guidelines. More than 30 active clinical studies are currently evaluating TAP supported therapies.

The updated TAP model builds on Blood Cancer United’s longstanding approach to funding science while expanding opportunities for collaboration with industry and philanthropic partners. By enabling directed donations to TAP and continuing to reinvest returns, the model is intended to help accelerate the pace of drug development.

Royalty Pharma Investor Relations and Communications

+1 (212) 883-6772
ir@royaltypharma.com

Blood Cancer United Media Contact

Sandra Salviejo
Senior Director, Communications, Blood Cancer United
sandrasalviejo@bloodcancerunited.org

The Project Represents $200 Million Agribusiness Investment

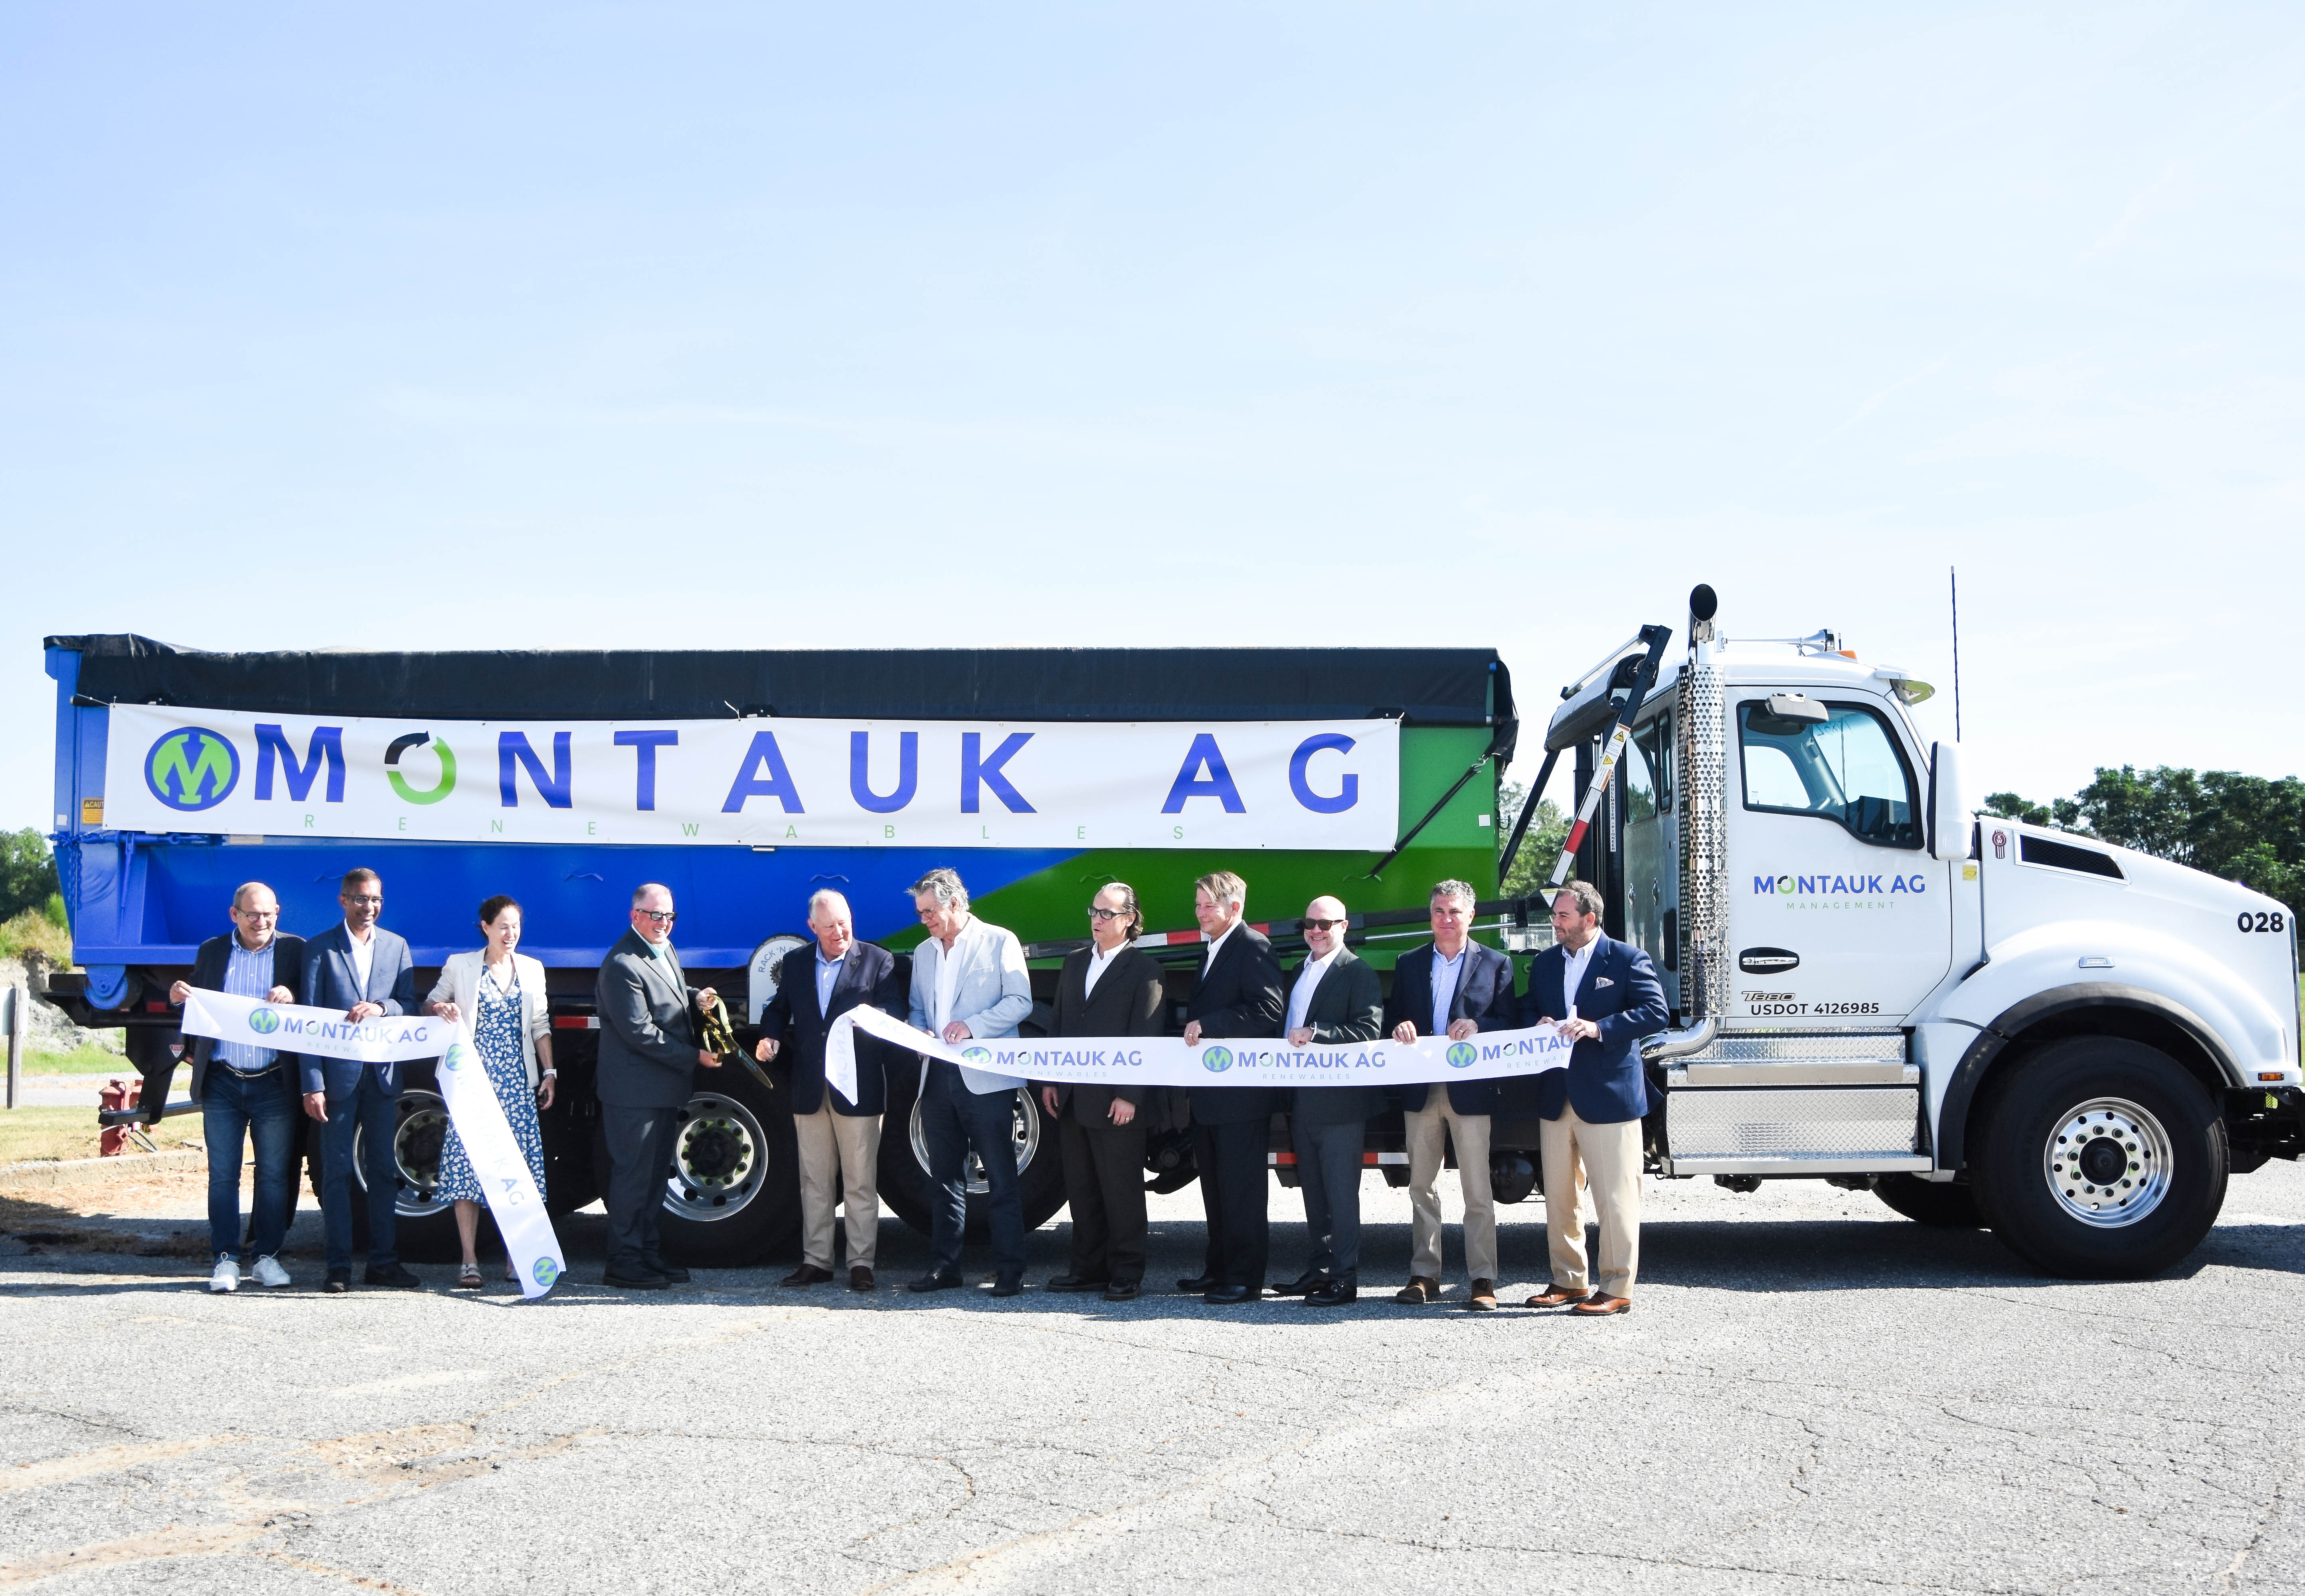
TURKEY, N.C., Sept. 15, 2026 (GLOBE NEWSWIRE) — Montauk Renewables, Inc. (NASDAQ: MNTK) (“Montauk” or the “Company”) and its subsidiary, Montauk Renewables Ag, LLC, announce that Sampson County leaders joined Montauk’s Chief Executive Officer, Sean McClain, and members of its Board of Directors to celebrate the official opening of the Company’s Turkey, NC facility. The project represents a $200 million capital investment and commitment to rural North Carolina.

“As of the end of August, we have entered into long-term agreements with over 80 separate farming locations, providing us access to more than 415,000 of the hog spaces we are targeting for our first phase of development. Farmers are the backbone of the North Carolina economy, and we are thankful to partner with them and Sampson County,” stated Sean McClain, Montauk Renewables CEO.

State and local officials worked with the Company to transform the former Bay Valley Foods Distribution Center into a major investment providing excellent jobs and expanding the tax base in Sampson County. The Company has developed technology that allows them to transform swine waste into electricity.

Senator Brent Jackson, a Sampson County farmer and leader on agricultural issues in the General Assembly, offered, “I am grateful that agriculture and agribusiness continue to invest and grow in North Carolina. Montauk’s capital investment is great news for Sampson County. This is not only good news for the pork producers, but the biochar produced here will also improve nutrient and water retention, supporting healthier soil and stronger crop yields.”

Senator Jackson serves as Chairman of the Appropriations Base Budget Committee and Chairman of the Agriculture, Energy and Environment Committee in the NC Senate.

Agriculture has an annual economic impact of more than $100 billion for the North Carolina economy, according to the N.C. Department of Agriculture. It is the state’s top industry, supporting roughly one in five jobs and spanning more than 42,000 farms across 8 million acres.

Montauk Pic

About Montauk Renewables, Inc.

Montauk Renewables, Inc. (NASDAQ: MNTK) is a renewable energy company specializing in the management, recovery and conversion of biogas into renewable natural gas (RNG). The Company captures methane, preventing it from being released into the atmosphere, and converts it into either RNG or electrical power for the electrical grid (“Renewable Electricity”). The Company, headquartered in Pittsburgh, Pennsylvania, has more than 30 years of experience in the development, operation and management of landfill methane-fueled renewable energy projects. The Company has operations at 14 projects and ongoing development projects located in California, Idaho, Ohio, Oklahoma, Pennsylvania, North Carolina, South Carolina, and Texas. The Company sells RNG and Renewable Electricity, taking advantage of Environmental Attribute premiums available under federal and state policies that incentivize their use. For more information, visit https://ir.montaukrenewables.com.

Company Contact:
John Ciroli
Chief Legal Officer (CLO) & Secretary
investors@montaukrenewables.com
(412) 747-8700

Investor Relations Contact:
Georg Venturatos
Gateway Group
georg@gateway-grp.com
(949) 574-3860

Public Relations Contact:
N.C. Capitol Strategies
info@ncapstrat.com

A photo accompanying this announcement is available at https://www.globenewswire.com/NewsRoom/AttachmentNg/cdb1a434-9e70-4764-b821-62d59fb491f4

Vancouver, BC, Sept. 15, 2026 (GLOBE NEWSWIRE) — Skyharbour Resources Ltd. (TSX-V: SYH) (OTCQX: SYHBF) (Frankfurt: SC1P) (“Skyharbour” or the “Company”) is pleased to announce that partner company Purecore Metals (“Purecore”) has commenced a comprehensive data compilation and technical review program at the Yurchison Uranium Property (“Yurchison” or the “Property”) in the Athabasca Basin, northern Saskatchewan. The program is intended to consolidate historical and modern geological, geochemical, geophysical and exploration information into an integrated project database and geological framework. The resulting dataset will be used to refine areas of interest, identify where multiple layers of technical evidence converge and prioritize targets for potential future field exploration.

Yurchison Property Map:
https://skyharbourltd.com/_resources/images/SkyHarbour_Yurchison.jpg?v2

Yurchison consists of 22 claims covering approximately 35,029 hectares of mineral tenure located in the Wollaston Domain of Northern Saskatchewan, Canada. Purecore may acquire an initial 70% interest in and to the Property, subject to a 2.0% net smelter return royalty retained by Skyharbour, by making cash payments to Skyharbour totalling C$350,000, issuing common shares of Purecore having an aggregate value of C$700,000, and incurring a minimum of C$3,500,000 in exploration expenditures on the Property. Purecore may earn an additional 30% interest in the Property, for a total 100% interest and subject to the NSR Royalty, by making an additional cash payment to Skyharbour of $3,000,000 and issuing additional common shares having a value of $3,000,000 for combined project consideration of $10,550,000.

Data Compilation and Target Generation:

Yurchison has been subject to historical airborne and ground geophysical surveys, geological mapping, prospecting, geochemical sampling and historical drilling. Much of the earlier exploration was completed prior to 2000, with additional modern airborne geophysical work completed in recent years. The current program is expected to include:

  • Compilation and digitization of available historical geological, geochemical, geophysical and drilling information;
  • Integration and interpretation of historical and modern airborne geophysical datasets;
  • Review of historical uranium occurrences, prospecting results and previous exploration targets;
  • Assessment of structural and geological controls that may be relevant to uranium mineralization;
  • Comparison of geophysical conductors, structural features, geochemical anomalies and historical exploration results; and
  • Ranking of priority areas for potential follow-up exploration.

Peter Berdusco, President and Chief Executive Officer of Purecore, commented: “Yurchison has decades of exploration history and a significant volume of modern geophysical data. This program brings that information together into an integrated geological framework to refine our understanding of the Property and prioritize areas for future exploration.”

Previous work at Yurchison includes a 1,424 line-kilometre high-resolution airborne magnetic survey completed at 50-metre line spacing, as well as earlier VTEM work that identified multiple geophysical zones of interest. Additional airborne magnetic, radiometric and VLF-EM surveys have also been completed across the Property.

Historical exploration at Yurchison identified uranium mineralization in several areas of the Property, including prospecting near historical trenches that returned values ranging from 0.09% to 0.30% U3O8. These results, together with historical and modern geophysical datasets, will form part of the current compilation and technical review.

Yurchison Property Summary:

Yurchison consists of 22 claims covering approximately 35,029 hectares of mineral tenure and is roughly 75 km south of Cameco’s Rabbit Lake operation, with Highway 905 running through the claims. It is underlain by Wollaston Supergroup metasedimentary gneisses, including psammopelitic to pelitic gneisses, graphitic pelitic gneisses adjacent to Archean granitic gneisses in the Eastern Wollaston Domain.

The Property area has seen significant historical exploration including airborne electromagnetic, magnetic, and radiometric surveys, as well as ground magnetic, EM, IP, and gravity surveys, prospecting, geological mapping, geochemical sampling, and drilling. The drilling was primarily conducted between the 1960’s and 1980’s with additional work completed in the mid-1990’s and 2000’s. Prospecting near old trenches returned uranium (0.09% to 0.30% U3O8) and molybdenum (2,500 ppm to 6,400 ppm) mineralization in both outcrop and float samples. The Property boasts strong discovery potential for both basement-hosted uranium mineralization as well as copper, zinc and molybdenum mineralization.

The majority of the work at Yurchison was completed before 2000, with limited follow-up since, and most of the Property remains underexplored. The historical exploration on the western side of Yurchison focused on uranium showings while on the eastern side of the Property it was largely focused on exploring SEDEX-style Pb-Zn mineralization following the discovery of the historic George Lake Pb-Zn Deposit proximal to the Property. There are several uranium, molybdenum, and thorium showings, which remain highly prospective for both basement-hosted uranium, pegmatite-hosted U-Th-REE, and sediment-hosted Cu-Pb-Zn mineralization. The most recent work included airborne EM (VTEM and VLF-EM), magnetics, and radiometrics surveys flown in 2022 and 2023.

Qualified Person:

The technical information in this news release has been prepared in accordance with the Canadian regulatory requirements set out in National Instrument 43-101 and reviewed and approved by Serdar Donmez, P.Geo., VP of Exploration for Skyharbour as well as a Qualified Person.

About Purecore Metals Inc.:

Purecore Metals Inc. is a mineral exploration company listed on the Canadian Securities Exchange (CSE: PURE) and the Frankfurt Stock Exchange (FSE: J8Y). Purecore is focused on advancing the materials that power modern energy systems and emerging technologies. Purecore is building a critical minerals portfolio aligned with long-term trends across the energy, technology, and defense sectors, with a strategy centered on high-impact opportunities and disciplined execution.

About Skyharbour Resources Ltd.:

Skyharbour holds an extensive portfolio of uranium exploration projects in Canada’s Athabasca Basin and is well positioned to benefit from improving uranium market fundamentals with interest in forty-four projects covering over 682,100 hectares (1.69M acres) of land. Skyharbour owns a 100% interest in the Moore Uranium Project, which is located 15 kilometres east of Denison’s Wheeler River project and 39 kilometres south of Cameco’s McArthur River uranium mine. Moore is an advanced-stage uranium exploration property with high-grade uranium mineralization at the Maverick Zones. Adjacent to Moore, Skyharbour is advancing several uranium properties within the broader Russell Lake project area with its joint venture partner and large strategic shareholder Denison Mines. Collectively these co-flagship projects host multiple zones of high-grade uranium mineralization across a highly prospective land package with significant exploration upside, and the Company is actively working on these assets through exploration and drilling programs.

Skyharbour now has joint ventures with industry-leaders Denison Mines and Orano Canada Inc. at the Russell Lake properties and the Preston project, respectively. The Company also has several active earn-in option partners, including CSE-listed Nexus Uranium Corp. at the Mann Lake Uranium Project; TSX-V listed North Shore Uranium at the Falcon Project; UraEx Resources at the South Dufferin and Bolt Projects; Future Fuels at the Highway Project; CSE-listed Mustang Energy at the 914W Project; CSE-listed Purecore Metals at the Yurchison Project, and TSX-V listed Terra Clean Energy at the South Falcon East Project. In aggregate, Skyharbour has now signed earn-in option agreements with partners that total to potentially over $79 million in partner-funded exploration expenditures and over $52 million in cash and share payments coming into Skyharbour, assuming that these partner companies complete the earn-ins at their respective projects.

Skyharbour’s goal is to maximize shareholder value through new mineral discoveries, committed long-term partnerships, and the advancement of exploration projects in geopolitically favourable jurisdictions.

Skyharbour’s Uranium Project Map in the Athabasca Basin:
https://www.skyharbourltd.com/_resources/news/SKY_SaskProject_Locator_2026-07-13_V2.jpg

To find out more about Skyharbour Resources Ltd. (TSX-V: SYH) visit the Company’s website at www.skyharbourltd.com.

SKYHARBOUR RESOURCES LTD.

“Jordan Trimble”
                                                                               
Jordan Trimble
President and CEO

For further information contact myself or:
Nicholas Coltura
Corporate Communications Manager
Skyharbour Resources Ltd.
Telephone: 604-558-5847
Toll Free: 800-567-8181
Facsimile: 604-687-3119
Email: info@skyharbourltd.com

NEITHER THE TSX VENTURE EXCHANGE NOR ITS REGULATION SERVICES PROVIDER ACCEPTS RESPONSIBILITY FOR THE ADEQUACY OR ACCURACY OF THE CONTENT OF THIS NEWS RELEASE.

Forward-Looking Information

This news release contains “forward‐looking information or statements” within the meaning of applicable securities laws, which may include, without limitation, the intended use of proceeds from the Private Placement. All statements in this news release, other than statements of historical facts, that address events or developments that the Company expects to occur, are forward-looking statements. Although the Company believes the expectations expressed in such forward-looking statements are based on reasonable assumptions, such statements are not guarantees of future performance and actual results may differ materially from those in the forward-looking statements. Such statements and information are based on numerous assumptions regarding present and future business strategies and the environment in which the Company will operate in the future, including the price of uranium, the ability to achieve its goals, that general business and economic conditions will not change in a material adverse manner, that financing will be available if and when needed and on reasonable terms. Such forward-looking information reflects the Company’s views with respect to future events and is subject to risks, uncertainties and assumptions, including the risks and uncertainties relating to the interpretation of exploration results, risks related to the inherent uncertainty of exploration and cost estimates and the potential for unexpected costs and expenses, and those filed under the Company’s profile on SEDAR+ at www.sedarplus.ca. Factors that could cause actual results to differ materially from those in forward looking statements include, but are not limited to, continued availability of capital and financing and general economic, market or business conditions, adverse weather or climate conditions, failure to obtain or maintain all necessary government permits, approvals and authorizations, failure to obtain or maintain community acceptance (including First Nations), decrease in the price of uranium and other metals, increase in costs, litigation, and failure of counterparties to perform their contractual obligations. The Company does not undertake to update forward‐looking statements or forward‐looking information, except as required by law.               

Osisko Metals creates new critical minerals company

New Brunswick copper project -- excellent infrastructure.
New Brunswick copper project — excellent infrastructure.

Principal Project: Cu-Ag-Au Porphyry-Skarn in Northern New Brunswick

Defined Target Area Has Alteration Footprint Larger than Gaspé Copper Project

Spin-Out Osisko Critical Minerals Corporation to Commence Exploration Following Completion of the Transaction

TORONTO, Sept. 15, 2026 (GLOBE NEWSWIRE) — Osisko Metals Incorporated (the “Company” or “Osisko Metals”) (TSX: OM; OTCQX: OMZNF; FRANKFURT: 0B51) is pleased to announce its intentions to create a new mineral exploration company to be named “Osisko Critical Minerals Corporation” (“OCMC”), which will be led by John Burzynski as Chief Executive Officer. OCMC is designed to unlock the value of Osisko Metals non-core projects by transferring a portfolio of mineral exploration properties located in New Brunswick (the “Properties”) into OCMC, a dedicated, standalone vehicle.

Incoming CEO John Burzynski commented: “We are excited by the prospect of this new copper and critical minerals exploration company and the assets it brings forward. New Brunswick has been home to major metal deposits in the past, and we believe there is excellent potential for defining a significant mineralized bulk-tonnage porphyry-skarn deposit on OCMC’s assets. Historically there has been no exploration for these systems in northern New Brunswick, despite a near-identical geological setting and the relatively close proximity to the Gaspé Copper Project. Much as the Osisko companies redefined gold exploration in Québec with our past work at Canadian Malartic and at Windfall, we believe there is significant untested potential on the assets that will be transferred to OCMC, which could lead to the discovery of new copper deposits in New Brunswick. Plans for OCMC will include an aggressive exploration program and drilling, planned to start following the conclusion and financing of the transaction.”

Creation of OCMC

In connection with its creation, the Company intends to explore financing alternatives, with Osisko Metals to retain a minority interest in OCMC following completion of any such financing. An overview of the Properties is included below. Additional details will be provided as matters progress.

The completion of the transaction and the exact form and consideration of vending the Properties into OCMC are subject to a number of conditions, including the completion of legal and tax structuring analyses; completion of financial analysis; determination of the structure and amount of funding of OCMC; determination of final details of the transaction; settlement of the board of directors and management team for OCMC; and required regulatory approvals. There can be no assurance that any securities of OCMC will be listed on any stock exchange.

Benefits of the Transaction

The transaction will provide shareholders of Osisko Metals with an indirect interest in OCMC through the Company’s retained ownership interest in OCMC, which will allow the capital markets to ascribe value to the Properties independently of Osisko Metals core property assets.

The proposed transaction will enable Osisko Metals to focus on advancing its flagship project, the past-producing Gaspé Copper mine located near Murdochville in Québec’s Gaspé Peninsula. The Company is currently completing resource expansion work on the Gaspé Copper Project, which hosts current pit-constrained Measured and Indicated Mineral Resources of 1.83 Bt averaging 0.32% CuEq and Inferred Mineral Resources of 239 Mt averaging 0.46% CuEq. For more information see the technical report prepared in accordance with NI 43-101 titled “NI 43-101 Technical Report on the Gaspé Copper Project with an Updated Mineral Resource Estimate for the Copper Mountain Deposit, Québec, Canada” dated May 28, 2026 (with an effective date of January 17, 2026) available on SEDAR+ (www.sedarplus.ca) under Osisko Metals’ issuer profile.

OCMC Highlights

The Properties comprise an aggregate of 2,972 mineral claim units (approximately 645 square kilometres) staked by the Company and claims which Osisko Metals has an option to acquire pursuant to three separate option agreements (the “Option Agreements”, entered into on January 9, 2026; April 20, 2026; and September 9, 2026 respectively). In connection with the transaction, the Option Agreements will be assigned to OCMC in exchange for shares of OCMC. The Properties include several large-scale mineral exploration targets prospective for copper, silver and gold, underlain by highly prospective geology similar in context to the nearby Gaspé Copper Project.

NB Copper Project

The NB Copper Project located in northern New Brunswick represents a compelling new copper exploration opportunity in a proven mining jurisdiction and is readily accessible via paved highways and gravel roads. The project area is situated on Crown land facilitating cost-effective exploration and permitting activities.

Geologically, the project lies within the Popelogan–Victoria Arc, immediately south of the Gaspé Belt. Multiple Devonian porphyritic intrusive phases of granodiorite characterize this regional tectonic setting, and porphyry emplaced into sedimentary, felsic volcanic, and mafic volcanic host rocks – geological conditions analogous to those observed at the Gaspé Copper Project.

Historical exploration efforts in the area focused primarily on identifying high-grade skarn-style mineralization and were generally limited in scale, with only sparse shallow drilling. No comprehensive, modern exploration program has been conducted to assess the potential for large-scale, low-grade bulk-tonnage copper systems like the mineralization model currently being advanced at the Gaspé Copper Project.

Past drilling intersected multiple copper-bearing zones and skarn mineralization, however, exploration and drilling were largely confined to near-surface showings. Mineralization and skarn/porcellanite alteration has been identified across multiple geological units, extending over an interpreted area of nominally 5 kilometres x 2 kilometres, similar to the Copper Brook alteration aureole which characterizes the Gaspé Copper deposit. The property also hosts 21 additional porphyry intrusions that have never been evaluated for their bulk-tonnage copper potential.

Highlights

  • The NB Copper Project presents a large exploration target that has not been systematically drill-tested and hosts significant potential for bulk tonnage deposits similar to the Gaspé Copper Project;
  • Large land package (430 square kilometres);
  • Devonian calc-alkaline porphyries intruded into Siluro-Devonian calcareous pelites and limestones (analogue to Gaspé Copper Project setting);
  • Previous work has defined a large (minimum 5 kilometre x 2 kilometre) near-surface porcellanite/skarn alteration zone: a hydrothermal system larger in scale than the Gaspé Copper Project (3.5 kilometre x 2.5 kilometre), with local near-surface and surface copper mineralization;
  • Sparse historical drilling focused on exploring for near-surface high-grade copper skarn mineralization (less than 200 metres deep). Only two deeper (500 metres – 600 metres) holes have been drilled, both showing skarn/porcellanite alteration from top to bottom, similar to that found at Gaspé Copper, with anomalous copper-gold mineralization near surface where analyses were made.

Bathurst Mining Camp

The main assets within the Bathurst Mining Camp (“BMC”) holdings include the Key Anacon and Gilmour South Mineral Resource (Table 1) as well as the Mount Fronsac occurrence. The Key Anacon mineral resource estimate was completed in 2019 and hosts indicated mineral resources of 1.96 Mt averaging 5.77% zinc, 2.38% lead, 0.22% copper and 68.9 g/t silver (9.00% ZnEq) and inferred mineral resources of 3.85 Mt averaging 5.34% zinc, 1.49% lead, 0.32% copper and 47.7 g/t silver (7.96% ZnEq).

For more information see the technical report prepared in accordance with NI 43-101 titled “NI 43-101 Maiden Resource Estimate for the Bathurst Mining Camp, New Brunswick, Canada” dated April 4, 2019 (with an effective date of February 20, 2019) available on SEDAR+ (www.sedarplus.ca) under Osisko Metals’ issuer profile.

Table 1: For more information see the technical report prepared in accordance with NI 43-101 titled “NI 43-101 Maiden Resource Estimate for the Bathurst Mining Camp, New Brunswick, Canada” dated April 4, 2019 (with an effective date of February 20, 2019) available on SEDAR+ (www.sedarplus.ca) under Osisko Metals’ issuer profile.

The Mount Fronsac deposit contains an historical, non-NI 43-101 compliant, unclassified mineral resource estimate of 1.26 million tonnes averaging 7.65 % Zn, 2.18 % Pb, 0.14% Cu, 40.3 g/t Ag, and 0.40 g/t Au.

Additional Information

There is no certainty that the transaction will be completed on the terms proposed or at all. The board of directors of Osisko Metals may determine not to proceed with the transaction should there be a change in market conditions or investor interest or should another opportunity arise that would similarly enhance value for Osisko Metals’ shareholders.

Osisko Metals will provide updates when further details of the proposed transaction are determined.

Scientific and Technical Disclosure

Qualified Person

The scientific and technical information within this news release was reviewed and approved by Jared Hansen, P.Geo. (APEGNB M9393) a “qualified person” within the meaning of NI 43-101 – Standards of Disclosure for Mineral Projects (“NI 43-101“) who is not independent of the Company for purposes of Section 1.5 of NI 43-101.

Cautionary Note Regarding Historical Mineral Resource Estimate

The historical mineral resource estimate for the Mount Fronsac deposit disclosed herein is based on historical data and reports. A qualified person has not done sufficient work to classify the historical estimate as a current mineral resource. The Company is not treating the historical estimate as a current mineral resource as defined in NI 43-101. The historical estimate should not be relied upon. There is no guarantee that any part of the historical mineral resource estimate will be confirmed as a current mineral resource or upgraded to an indicated or measured mineral resource category with additional work. Readers are cautioned that the historical mineral resource estimate does not use categories consistent with CIM Definition Standards on Mineral Resources and Mineral Reserves. Significant capital expenditure and additional technical work, including drilling and analysis, would be required to verify and, if warranted, upgrade or reclassify the historical estimate as a current mineral resource.

About Osisko Metals

Osisko Metals Incorporated is a Canadian exploration and development company creating value in the critical metals sector, with a focus on copper and zinc. The Company acquired a 100% interest in the past-producing Gaspé Copper mine from Glencore Canada Corporation in July 2023. The Gaspé Copper Project is located near Murdochville in Québec’s Gaspé Peninsula. The Company is currently focused on resource expansion of the Gaspé Copper deposits, with current pit-constrained Measured and Indicated Mineral Resources of 1.83 Bt averaging 0.32% CuEq and Inferred Mineral Resources of 239 Mt averaging 0.46% CuEq (in compliance with NI 43-101). For more information, see the technical report titled “NI 43-101 Technical Report on the Gaspé Copper Project with an Updated Mineral Resource Estimate for the Copper Mountain Deposit, Québec, Canada” dated May 28, 2026 (with an effective date of January 17, 2026), a copy of which is available on SEDAR+ (www.sedarplus.ca) under Osisko Metals’ issuer profile. Gaspé Copper hosts the largest undeveloped copper resource in eastern North America, strategically located near existing infrastructure in the mining-friendly province of Québec.

In addition to the Gaspé Copper Project, the Company is working with Appian Capital Advisory LLP through the Pine Point Mining Limited joint venture to advance one of Canada’s largest past-producing zinc mining camps, the Pine Point project, located in the Northwest Territories. The current mineral resource estimate for the Pine Point project consists of Indicated Mineral Resources of 49.5 Mt averaging 5.52% ZnEq and Inferred Mineral Resources of 8.3 Mt averaging 5.64% ZnEq (in compliance with NI 43-101). For more information, see the technical report titled “NI 43-101 Technical Report, Pine Point Zinc-Lead Project, Mineral Resource Estimate Update, Hay River, Northwest Territories, Canada” dated August 9, 2024 (with an effective date of May 31, 2024), a copy of which is available on SEDAR+ (www.sedarplus.ca) under Osisko Metals’ issuer profile. The Pine Point project is located on the south shore of Great Slave Lake, Northwest Territories, close to infrastructure, with paved road access, an electrical substation and 100 kilometres of viable haul roads.

For further information on this news release, visit www.osiskometals.com or contact:

Don Njegovan, President
Email: info@osiskometals.com
Phone: (416) 500-4129

Cautionary Note Regarding Forward-Looking Information

This news release contains “forward-looking information” within the meaning of applicable Canadian securities legislation based on expectations, estimates and projections as at the date of this news release. Any statement that involves predictions, expectations, interpretations, beliefs, plans, projections, objectives, assumptions, future events or performance (often, but not always, using phrases such as “expects” or “does not expect”, “is expected”, “interpreted”, “management’s view”, “anticipates” or “does not anticipate”, “plans”, “budget”, “scheduled”, “forecasts”, “estimates”, “potential”, “feasibility”, “believes” or “intends” or variations of such words and phrases or stating that certain actions, events or results “may”, “could”, “would”, “might” or “will” be taken, occur or be achieved) are not statements of historical fact and may be forward-looking information and are intended to identify forward-looking information. This news release contains forward-looking information pertaining to, among other things: statements with respect to the terms, timing and outcome of the creation of OCMC; that John Burzynski will lead OCMC as Chief Executive Officer; that OCMC will unlock the value of the Properties; that there is good potential for defining a significant copper mineralized porphyry-skarn system on OCMC’s assets; that there could be significant untested potential on the Properties which could lead to the discovery of a significant new copper deposit in New Brunswick; plans for an aggressive exploration program for OCMC and the timing thereof; the potential funding of OCMC; Osisko Metals’ retention of an interest in OCMC; receipt of the required regulatory approvals in connection with the transaction; the anticipated benefits of the transaction; the assets to be transferred to OCMC; anticipated strategic and growth opportunities; disclosure of additional details of the transaction; and the future plans and objectives of the Company and OCMC.

Forward-looking information is not a guarantee of future performance and is based upon a number of estimates and assumptions of management, in light of management’s experience and perception of trends, current conditions and expected developments, as well as other factors that management believes to be relevant and reasonable in the circumstances, including, without limitation, assumptions about: completion of the transaction, including the ability of the parties to receive, in a timely manner and on satisfactory terms, the necessary approvals for the transaction; the ability of the parties to satisfy, in a timely manner, the other conditions to the completion of the transaction; that the anticipated benefits of the transaction will be realized; that general business and economic conditions will not change in a material adverse manner, that financing will be available if and when needed and on reasonable terms, that third party contractors, equipment and supplies and governmental and other approvals required to conduct the Company’s and OCMC’s planned exploration activities will be available on reasonable terms and in a timely manner, the ability of exploration results, including drilling, to accurately predict mineralization; errors in geological modelling; insufficient data; equity and debt capital markets; future spot prices of minerals; the timing and results of exploration and drilling programs; the accuracy of mineral resource estimates; production costs; political and regulatory stability; the receipt of governmental and third party approvals; licenses and permits being received on favourable terms; sustained labour stability; stability in financial and capital markets; availability of mining equipment and positive relations with local communities and groups. Forward-looking information involves risks, uncertainties and other factors that could cause actual events, results, performance, prospects and opportunities to differ materially from those expressed or implied by such forward-looking information. Factors that could cause actual results to differ materially from such forward-looking information are set out in the Company’s public disclosure record on SEDAR+ (www.sedarplus.ca) under Osisko Metals’ issuer profile.

Although the Company believes that the assumptions and factors used in preparing the forward-looking information in this news release are reasonable, undue reliance should not be placed on such information, which only applies as of the date of this news release, and no assurance can be given that such events will occur in the disclosed time frames or at all. The Company disclaims any intention or obligation to update or revise any forward-looking information, whether as a result of new information, future events or otherwise, other than as required by law.

Photos accompanying this announcement are available at:
https://www.globenewswire.com/NewsRoom/AttachmentNg/b2f7f12c-f206-49e4-825f-22d59d592935
https://www.globenewswire.com/NewsRoom/AttachmentNg/c61178c5-4a6d-4ea2-b245-a7436ac55190

Privacy Overview

This website uses cookies so that we can provide you with the best user experience possible. Cookie information is stored in your browser and performs functions such as recognising you when you return to our website and helping our team to understand which sections of the website you find most interesting and useful.