Passengers on United airplanes with Starlink-enabled seatback screens have access to live college and pro football games starting this week across 9 major sports networks

ENGLEWOOD, Colo., Sept. 17, 2026 (GLOBE NEWSWIRE) — Flying on game day no longer means missing a single play. EchoStar Corporation (NASDAQ: ECHO) today announced DISH and United Airlines are teaming up to bring live college and professional football straight to passengers’ Starlink-enabled seatback screens for the 2026–2027 season.

DISH is delivering a premier lineup of nine live television channels, ensuring sports fans can see every touchdown, field goal, and game-winning drive from departure to touchdown.

The service launches on more than 200 Starlink-equipped United mainline aircraft this week and is expected to be available on nearly 700 planes by February 2027.

The live channel lineup features the ultimate sports destination list: ABC, CBS, FOX, NBC, ESPN, ESPN2, FS1, NFL Network, and TNF on Prime Video.

“With United, we are helping to rewrite the inflight playbook,” said Amir Ahmed, Executive Vice President, Video Services. “Whether you’re sitting on your couch or cruising at 35,000 feet, you should be able to watch your favorite teams play. By pairing DISH’s OnStream platform with United’s Starlink connectivity, we’re keeping fans connected to the moments that matter most.”

The rollout represents a collaborative effort between DISH and United Airlines, to utilize the OnStream platform for next-generation aviation environments.

The OnStream platform provides a robust, configurable, and interactive user entertainment delivery experience for guests across numerous business verticals including Hospitality, Senior Living, Aviation, and others. Click here to learn more about the OnStream platform.

About EchoStar Corporation
EchoStar Corporation (Nasdaq: ECHO) is a premier provider of technology, networking services, television entertainment and connectivity, offering consumer, enterprise, operator and government solutions worldwide under its EchoStar®, Boost Mobile®, Sling TV, DISH TV, Hughes®, HughesNet®, HughesON™, and JUPITER™ brands. In Europe, EchoStar operates under its EchoStar Mobile Limited subsidiary and in Australia, the company operates as EchoStar Global Australia. For more information, visit www.echostar.com and follow EchoStar on X (Twitter) and LinkedIn.

©2026 EchoStar. Hughes, HughesNet, DISH, and Boost Mobile are registered trademarks of one or more affiliate companies of EchoStar Corp.

Media Contact
news@dish.com

A SOLID FIRST HALF 2026

  • Organic revenue growth of 2.8%
  • Recurring EBITDA of €94 million, or 21.1% of revenue
  • Organic growth of between +3% and +5% for FY 2026

Grasse, September 17, 2026 – At its meeting on September 16, 2026, Robertet’s Board of Directors, chaired by Philippe Maubert, approved the Group’s results for first-half 2026.

Consolidated financial statements*

in thousands of euros

H1 2026 % of revenue H1 2025 % of revenue Year-on-year change
Revenue 444,281   446,337   -0.5%
Recurring EBITDA 93,646 21.1% 100,222 22.5% -6.6%
Operating income 75,424 17.0% 85,138 19.1% -11.4%
Net income attributable to owners of the Company 54,154 12.2% 58,501 13.1% -7.4%
Earnings per share (in euros) 25.8   27.9    

* The financial statements have been reviewed by the Statutory Auditors; their review report was issued on
September 17, 2026.

Change in revenue

Consolidated net revenue for the first half of 2026 amounted to €444 million, with organic growth of 2.8% at constant exchange rates and scope. Reported revenue at current exchange rates was slightly lower than in the same period of 2025.

By division, Fragrances (up 13%) maintained strong momentum, driven by niche fine fragrance brands and the emergence of new players, particularly in Latin America and in the Middle East. The Raw Materials (down 6%) and Flavors (down 2%) divisions faced a more challenging environment, following several years of strong growth and high bases of comparison in 2025. Health & Beauty (up 11%) continued to benefit from initiatives aimed at expanding its markets.

By region1, the traditional markets – Europe and North America (down 1%) – moved at a more measured pace, while the other regions enjoyed strong momentum. South America (up 21%) continued to see robust growth, driven in particular by Brazil, while Asia (up 12%) was boosted by the ramp-up of investments in Indonesia and India. Robertet generates more than 80% of its revenue internationally.

Continued high profitability

Recurring EBITDA for first-half 2026 came to €94 million, or 21.1% of revenue, compared with €100 million in first-half 2025 – still a notably strong performance considering the unstable environment. The year-on-year decline is primarily due to ongoing investments to support the Group’s future growth, particularly in manufacturing capacity, the expansion of the scientific and sales teams, and information systems.

Operating income totaled €75 million, or 17.0% of revenue, from €85 million in the first half of 2025. This trend also reflects the increase in depreciation and amortization expenses associated with industrial investments and commercial expansion.

Financial income improved thanks to the decrease in debt servicing costs and less adverse currency effects than in 2025. Attributable net income amounted to €54 million, or 12.2% of revenue, compared with €59 million in first-half 2025.

ESG: progress made on sustainable sourcing and climate matters

As part of its ongoing commitment to sustainable sourcing, Robertet has a total of 67 supply chains with CSR verification or certification. Since the beginning of the year, additional certifications have been added, including one for Robertet’s iconic damascena rose supply chain in Bulgaria.

Robertet raised the bar on its climate goals in October 2025 with the validation of its carbon emissions reduction targets by the Science-Based Targets initiative (SBTi). Carbon-reduction plans through 2033 covering Scope 1, 2, and 3 emissions have been developed and are now being implemented.

By continuing to prioritize its CSR commitments, Robertet was able to retain its Platinum rating in its most recent EcoVadis assessment, received in August 2026, with a steadily improving score that places it among the top 1% of companies assessed worldwide.

Outlook

After a first half of the year marked by more moderate market conditions and given limited visibility, Robertet is targeting organic revenue growth of between 3% and 5% for full-year 2026.

The Group remains confident in its growth prospects, reaffirms its 2030 goals, and continues to pursue its investment strategy to support future growth.

Philippe Maubert, Chairman of Robertet’s Board of Directors, commented: “In a period of geopolitical uncertainty, Robertet has once again demonstrated the strength of its business model, which is based on natural products, agility, and independence. We are pursuing our strategy of growth and value creation with confidence.”

Jérôme Bruhat, Robertet’s Chief Executive Officer, added: “Our organic growth and profitability confirm Robertet’s momentum in the first half of the year, driven by the Fragrance Division and new growth regions. In an unstable environment, we combine strict budget control with forward-looking investments to support the future growth of the Group for the benefit of our customers.”

An earnings call will be held on Friday, September 18, 2026 at 11:00 a.m. (CET).

  • To register for the webcast, please click here.
  • To register for the analyst conference call, please click here.

Financial calendar

  • September 21, 2026: publication of the 2026 half-year financial report
  • February 11, 2027: 2026 full-year revenue press release

About the Robertet Group

Robertet SA was founded in Grasse in 1850 and is the world leader in natural products. Based in France and mostly family-owned since its creation, the Robertet Group is still controlled by the Maubert family and is the only fragrance, flavor and natural ingredient company that is fully integrated throughout the entire creative process, from source to final fragrance or flavor. Today, the Robertet Group is represented in more than 50 countries, employs around 2,800 people worldwide and offers its customers a range of over 1,600 natural materials and bespoke products created in one of its 18 global creation centers. In 2025, the Robertet Group recorded total revenue of more than €843 million.

www.robertet.com

Investor contact

Matthieu Lugez: matthieu.lugez@robertet.com / ir@robertet.com

Press contacts

Clélia Revinci: clelia.revinci@robertet.com

Teneo: robertet@teneo.com / +33 (0)6 17 96 61 41

ADDITIONAL INFORMATION

***

RECONCILIATION BETWEEN RECURRING EBITDA AND OPERATING INCOME

In thousands of euros H1 2026 H1 2025 H1 2024
Operating income 75,424 85,138 73,052
Additions to and reversals of depreciation, amortization and provisions 18,209 14,947 16,024
Other operating expenses 15 88 86
Asset disposals (2) 49 (243)
Recurring EBITDA* 93,646 100,222 88,919

* Recurring EBITDA corresponds to operating income before additions to and reversals of depreciation, amortization and provisions, and excluding other operating expenses that are considered non-recurring.

***
KEY BALANCE SHEET INDICATORS

In thousands of euros June 30, 2026 December 31, 2025 June 30, 2025
Equity (attributable to owners of the Company) 647,096 602,502 557,438
Net cash (net debt) position* (79,734) (72,715) (121,108)
Current assets – Current liabilities 434,534 408,137 421,821

* Net cash (net debt) position = cash and cash equivalents plus other current financial assets minus financial liabilities (including IFRS 16 financial liabilities)

REMINDER

At June 30, 2026, the change in revenue breaks down as follows in terms of organic growth, scope effect and currency effect:

***

Revenue
in thousands of euros
H1 2026 H1 2025 Organic growth (%) Currency
effect
Scope effect Change (%)
Group total 444,281 446,337 +2.8% -3.0% -0.3% -0.5%

***
BREAKDOWN BY DIVISION

Revenue

in thousands of euros

H1 2026 H1 2025 Change (%) Organic growth (%)
Group total 444,281 446,337 -0.5% +2.8%
Raw Materials 106,972 117,294 -8.8% -5.5%
Fragrances 175,667 159,741 +10.0% +12.6%
Flavors 148,874 157,659 -5.6% -1.7%
Health & Beauty 12,768 11,643 +9.7% +11.3%


1 By delivery region.

Attachment

Exit from a major telecommunications framework contract in France, the final step in the Group’s transformation 

  • Exit from a large French contract in this sector, operating at a loss and accounting for 13% of consolidated revenue (2025)
  • Elimination of the Group’s main source of losses and refocusing of its French operations on the Energy and Technology markets
  • Deliberate reduction in revenue to sustainably improve the Group’s profitability

Earnings for the first half of 2026 reflect the impact of the final streamlining measures

  • Revenue of €400.3 million is down -11.1%1, primarily reflecting the accelerated withdrawal from the framework contract in the telecommunications segment in France
  • Adjusted EBITDA of €17.0 million, representing a margin of 4.2%, down 280 basis points, reflecting the temporary effects of final transformation measures in France and a repositioning of the customer base in Germany
  • Net income attributable to the Group of €-24.5 million, compared with €-16.8 million in the first half of 2025
  • Gross cash of €46.3 million and net bank debt of €67.1 million at the end of June 2026, compared to €56.1 million at the end of June 2025

The second half of 2026 will be devoted to completing the transformation, paving the way for a new cycle in 2027

  • Completion by the end of 2026 of the exit from the French telecommunications contract and all associated restructuring measures
  • Germany: Initial effects of the repositioning are expected, with a significant improvement in margins in the second half of the year
  • Starting in 2027, a more focused scope of operations, a more favorable business mix, and an optimized cost structure will pave the way for a marked improvement in the Group’s profitability

Solutions30 SE is releasing today its consolidated financial statements for the period from January 1 to June 30, 2026, prepared in accordance with IFRS. The consolidated financial statements of the Solutions30 Group for the period from January 1 to June 30, 2026, as approved by the Management Board, were reviewed by the Supervisory Board on September 17, 2026. The review of the half-yearly financial information by the statutory auditor has been completed and their report has been published on the website. The half-yearly financial report, including the consolidated financial statements (condensed interim consolidated financial statements and notes) reviewed by the auditor, is available on the Solutions30 website, www.solutions30.com, in the “Investors Relations” section.

Gianbeppi Fortis, Chief Executive Officer of Solutions30, stated: “We have decided to withdraw from a major telecommunications framework contract in France, thereby eliminating the Group’s remaining source of losses. The first-half results directly reflect this decision and the adjustments it entails. The exit from this business and the associated restructuring will be completed by the end of 2026. The outcome will mark the culmination of the transformation we began two years ago to exit mature markets where our margins had become insufficient and focus our resources on our growth markets, particularly in Energy and Technology. Starting in 2027, Solutions30 will have a smaller but more focused scope, one that is significantly more profitable and ready to redeploy its model in markets where its expertise, European footprint, and ability to execute at scale constitute genuine competitive advantages.”

2026: The Final Stage of a Decisive Transformation

Since 2024, Solutions30 has been undergoing a major transformation aimed at refocusing its portfolio on the businesses and markets offering the best prospects for growth and profitability. The Group has gradually withdrawn from mature markets where its business model was no longer able to generate sufficient value, while developing new growth drivers in Energy, Technology, and in telecommunications in Germany. This strategy is already yielding tangible results: The adjusted EBITDA margin for the Other Countries segment improved by 620 basis points over two years, while Benelux, the Group’s leading geographic area in terms of revenue, confirmed its role as profitability anchor, with a margin consistently at a double-digit level.

This transformation will enter its final phase in 2026. Announced on August 3, 2026, the exit from a major framework contract in the French telecommunications sector, which had generated €117.6 million in revenue in 2025, representing 38% of the company’s French business and 13% of the Group’s total revenue (respectively 33% and 10% in the first half of 2026), marks the final stage of this process. Unprofitable, this contract was the Group’s primary source of losses and limited the growth potential of its other French operations, particularly in the energy sector. The exit and related restructuring measures will be finalized by the end of 2026.

Solutions30 has made a deliberate choice to adopt a narrower scope that is better positioned and structurally more profitable. Starting in 2027, the Group will have a streamlined portfolio in France, a business mix refocused on its most attractive markets in Energy and Technology, and a cost structure tailored to its new level of activity. This foundation should enable the company to reallocate its resources toward its key growth drivers and embark on a new cycle of profitable growth.

Key figures – Consolidated data

In millions of euros H1 2026 H1
2025 restated*
Change
Revenue 400.3                 450.2                 (11.1)%
Adjusted EBITDA 17.0                 31.6                 (46.3)%
As % of revenue (adjusted EBITDA margin) 4.2%                 7.0%  
Adjusted EBIT (6.3)                 5.2                 (219.4)%
As % of revenue (1.6)%                 1.2%  
Operating income (13.5)                 (8.5) n/a
As % of revenue (3.4)%                 (1.9)%  
Net income, group share (24.5)                 (16.8) n/a
Adjusted net income, group share ** (21.2)                 (9.9) n/a
Free cash flow (25.5)                 (29.1) n/a
Net free cash flow (41.3)                 (45.3) n/a
       
Financial structure figures
In millions of euros
30.06.2026 31.12.2025 Change
Equity 24.7                 46.9                 (22.2)
Net debt 119.0                 99.6                 19.4
Net bank debt 67.1                 36.3                 30.8

* In accordance with the IFRS 5, the 2025 comparative figures in the income statement have been restated to reflect the classification of the United Kingdom and the divested telecommunications business in Spain as discontinued operations.
** Adjusted for “net income from discontinued operations” as reported in the group financial statements, as well as amortization of customer relations (group share) net of the associated tax impact, a purely accounting charge related to past acquisitions, with no cash impact and not related to tangible assets.

Solutions30’s consolidated revenue for the first half of 2026 amounted to €400.3 million, down -11.1% compared to revenue for the first half of 2025, restated to exclude the contribution from the United Kingdom and the divested telecommunications business in Spain, to reflect their classification as discontinued operations in accordance with IFRS 5. The Group divested these businesses in 2025, in line with its strategy of selectivity and refocusing on its most promising markets.

Organic growth stood at -13.6% and primarily reflects the exit from a major telecommunications framework contract in France, which will be fully completed by the end of 2026. Acquisitions contributed 2.6% and reflect the full consolidation of So-tec following the increase in the Group’s stake in the company in April 2025. The impact of the change is negligible.

In the second quarter, revenue reached €197.1 million, down -13.6% compared to the second quarter of 2025 (on a restated basis).

The Group’s adjusted EBITDA amounted to €17.0 million in the first half of 2026, down -46.3% compared to the first half of 2025 (on a restated basis). The adjusted EBITDA margin stood at 4.2%, down 280 basis points. This change is primarily driven by France, which is experiencing the effects of the termination of its major telecommunications contract. It is also attributable, to a lesser extent, to the performance in Germany, where the margin was negatively impacted in the first half of the year by one-time costs related to the termination of a contract with a FiberCo as part of the repositioning of its customer base toward incumbent carriers. Since all impacts were recognized in the first half of the year, the margin in Germany is expected to increase in the second half.

Net income attributable to the Group was €-24.5 million, compared with €-16.8 million in the first half of 2025. The decline, which was limited to €-7.7 million despite a sharper drop in adjusted EBITDA, is primarily attributable to the recognition of non-recurring income of €7.1 million. This reflects the accounting effects of the deconsolidation of legal entities operating the telecommunications contract terminated in France and liquidated during the half-year as part of the rationalization measures implemented by the Group.

The Group reported gross cash of €46.3 million at the end of June 2026. Net bank debt stood at €67.1 million at the same date, compared to €56.1 million at the end of June 2025 and €36.3 million at the end of December 2025. The increase in the first half of the year reflects cash outflows for the period, related to ongoing transformation initiatives and the Group’s usual seasonality, as well as a reduction of €-16.0 million in the use of factoring. The outstanding balance of receivables assigned under the Group’s non-recourse factoring program amounted to €45.3 million at the end of June 2026, compared with €61.4 million at the end of December 2025 and €62.4 million at the end of June 2025.

Analysis by geographical segment

In millions of euros H1 2026 H1 2025 restated* Change
Benelux      
Revenue         169.2                 181.4                 (6.7)        %
Adjusted EBITDA         19.0                 21.4                 (11.2)        %
Adjusted EBITDA margin %         11.2        %         11.8        %         (60)         bps
France      
Revenue         120.6                 154.3                 (21.8)        %
Adjusted EBITDA         (1.2)                 7.0                 (117.1)        %
Adjusted EBITDA margin %         (1.0)        %         4.5        %         (550)         bps
Germany      
Revenue         40.7                 47.3         (13.9)%
Adjusted EBITDA         (0.8)                 3.7         (121.6)%
Adjusted EBITDA margin %         (1.9)        %         7.9        %         (980)         bps
Other Countries      
Revenue         69.9                 67.2                 4.0        %
Adjusted EBITDA         5.0                 4.4                 +13.6        %
Adjusted EBITDA margin %         7.1        %  6.5        %         +60         bps
HQ**         (4.9)         (4.9)         —        %
Group      
Revenue         400.3                 450.2                 (11.1)        %
Adjusted EBITDA         17.0                 31.6                 (46.2)        %
Adjusted EBITDA margin %         4.2        %         7.0        %         (280)         bps

* In accordance with IFRS 5, the comparative figures for the first half of 2025 have been restated to reflect
the classification of the United Kingdom and the divested telecom business in Spain (“Other Countries” segment) as discontinued operations.

** Costs related to the Group’s centralized functions.

In the Benelux region, the Group’s largest geographic segment (accounting for 42.3% of total revenue in the first half of 2026), business remains resilient and structurally highly profitable.

Revenue amounted to €169.2 million, down -6.7% on an organic basis due to the scheduled completion of the rollout of digital meters in Belgium, an effect that was partially offset by the strong performance of the electricity grid services business. In the Connectivity business (82% of revenue), the Belgian competition authority formally approved, in July 2026, the plan for telecom operators to mutualize certain fiber deployment programs. This clarification paves the way for a gradual acceleration of this market. Solutions30 is expected to benefit in particular from the ramp-up of its business with Wyre and anticipates a gradual acceleration of its growth in the telecommunications sector.

Profitability in the Benelux region remains high, with an adjusted EBITDA margin of 11.2% in the first half of the year, compared with 11.8% a year earlier, and remains firmly in double digits. This performance reflects Solutions30’s strong operational execution in this region, which serves as a foundation for the Group’s profitability.

In France, revenue amounted to €120.6 million in the first half of 2026, down -21.9% (-28.7% organically). In the Connectivity segment, the Group is continuing to rapidly reduce its exposure to the French telecommunications market. This transformation is currently coming to fruition with the termination of a major framework contract still in effect in this segment. This contract had generated €117.6 million in revenue in 2025, accounting for 38% of Solutions30’s business in France (33% in the first half of 2026), but was loss-making. Its exit will be finalized by the end of 2026, and it will no longer contribute to the Group’s revenue starting in 2027.

During the first half of the year, the Energy business in France experienced the indirect repercussions of a significant reorganization of French entities, stemming from the withdrawal from the telecommunications contract. These repercussions negatively impacted its financial profile and revenue base. Specific measures have been implemented to reorganize this activity and put it back on a growth trajectory, in markets (electric grid services, photovoltaics, electric vehicle charging infrastructure, etc.) where fundamentals remain strong and demand for qualified technicians is high.

Adjusted EBITDA in France was €-1.2 million, representing a margin of -1.0%, heavily impacted by the downsizing of the entire French operation to align with its new level of activity. Nevertheless, the Technology segment posted a double-digit margin. The same applies to the So-Tec division, which is set to become the Group’s primary vehicle for development in the renewable energy sector in France.

France is expected to enter 2027 with a streamlined business base, focused on growth markets in Energy and Technology, and with improved profitability.

In Germany, the need for fiber deployment remains significant. However, the market structure has evolved: Investors specializing in fiber optics are becoming more selective, while established telecom operators which are financially stronger, are awarding larger contracts that offer greater visibility. Solutions30 is consequently repositioning its customer base by reducing its exposure to FiberCos and ramping up contracts signed with Deutsche Telekom and Vodafone. This transition weighed on business in the first half of 2026, with revenue of €40.7 million, representing a purely organic decline of -14.0%, reflecting the Group’s exit from a contract with a FiberCo.

Solutions30 completed the adjustment measures associated with this divestiture in the first half of the year. All operating losses and related costs were recognized during the period, significantly weighing on adjusted EBITDA, which came in at €-0.8 million, or -1.9% of revenue, compared to €3.7 million or 7.9% in the first half of 2025. Now that this phase has been completed, the margin in Germany is expected to improve significantly in the second half of the year.

Furthermore, Solutions30 is entitled to compensation under this contract. The amount is still under discussion with the customer, and no positive impact has been recognized in the first-half results. Subject to the finalization of these discussions, this compensation is expected to have a positive impact on second-half results.

In the Other Countries segment, the transformation that began two years ago has been completed in its key areas: exit from the United Kingdom, divestiture of the connectivity business in Spain, and refocusing on energy and technology; turnaround in Italy; and diversification into the energy sector in Poland through the acquisition of Elektra Realizacje. This transformation has facilitated a major repositioning of the segment toward its growth markets, leading to a 620-basis-point increase in its adjusted EBITDA margin between 2023 and 2025, on a narrower revenue base.

The segment’s results for the first half of 2026 confirm the success of this transformation: Revenue, at €69.9 million, increased by 4.0% (compared to the first half of 2025, restated for discontinued operations), driven by strong growth in Italy. The adjusted EBITDA margin rose again, by 60 basis points, to 7.1%, driven by an improved business mix favoring energy services.

Consolidated earnings

Based on adjusted EBITDA of €17.0 million in the first half of 2026, after recognizing impairment charges and operating provisions totaling €8.9 million (compared to €12.1 million in the first half of 2025), and after amortization of the right-of-use of leased assets (IFRS 16) of €14.4 million (compared to €14.3 million), the Group’s adjusted EBIT came in at €-6.3 million, compared to €5.2 million in the first half of 2025.

Operating income amounted to €-13.5 million, compared with €-8.5 million in the first half of 2025. It includes:

  • €-9.3 million in non-recurring operating expenses (compared to €-7.7 million in the first half of 2025), which include the cost of restructuring and headcount reductions undertaken by the Group primarily to scale back the French operations to match the company’s new level of activity, and to reorganize operations in Germany as part of the repositioning of the customer base;
  • Non-recurring operating income of €7.1 million, corresponding to the accounting effects of the deconsolidation of legal entities operating the telecommunications contract terminated in France and liquidated during the half-year as part of the rationalization measures implemented by the Group.
  • €5.1 million Amortization of customer relationships (€6.1 million for the first half of 2025). This charge, relating to past acquisitions, is purely accounting in nature, with no cash impact, and is not related to tangible assets.

The financial result came in at €-5.2 million, a slight improvement compared to the first half of 2025 (€-6.5 million).

After recording a net tax expense of €-3.9 million, consolidated net income amounted to €-22.6 million (€-16.4 million for the first half of 2025). After deducting minority interests of €1.9 million, net income attributable to the Group came to €-24.5 million, compared to €-16.8 million in 2025.

Cash flow

Note: The cash flow and balance sheet items presented below include the contribution from discontinued operations for the first half of 2025, which are reported separately in the consolidated financial statements in accordance with IFRS 5.

Cash flow for the first half of 2026 was, as expected, impacted by the restructuring measures implemented to complete the Group’s transformation, notably the termination of the major French telecommunications framework contract and the repositioning of its customer portfolio in Germany. Furthermore, given the seasonal nature of working capital requirements, the Group’s operating cash flow is typically lower in the first half of the year than in the second.

The Group’s cash flow from operations amounted to €6.8 million in the first half of 2026, compared with €20.4 million in the first half of 2025, a trend generally in line with that of adjusted EBITDA. The change in working capital (WC), adjusted for non-cash items, represents a negative cash flow of €-28.3 million compared to €-42.0 million in the first half of 2025. It includes a €-16.0 million reduction in factoring and the reclassification of a €14.1 million operating liability as other long-term liabilities, with no impact on cash. Excluding these two effects, the change in working capital was slightly positive in the first half. As a result, cash flow from operating activities for the first half of 2026 was €-21.5 million, at a similar lever to that recorded in the first half of 2025.

Net operating investments amounted to €-3.9 million, or 1.0% of revenue, in line with historical levels, and were primarily related to information systems and technical equipment.

In total, free cash flow amounted to €-25.5 million in the first half of 2026, compared to €-29.1 million in the first half of 2025. After accounting for changes in lease liabilities and related interest (IFRS 16) totaling €-15.9 million, net free cash flow amounted to €-41.3 million, compared with €-45.3 million in the first half of 2025.

Taking into account the earnouts paid on past acquisitions totaling €-0.3 million, acquisitions and disposals during the period, resulting in a net amount of cash acquired or disposed of (not significant in the first half of 2026), interest paid of €-3.1 million, distributions to minority shareholders (immaterial in the first half of 2026), the net change in bank loans of €18.0 million, and the impact of foreign exchange rates (immaterial in the first half of 2026), the change in the Group’s cash and cash equivalents amounted to €-26.9 million.

Financial structure

The Group’s gross cash balance stood at €46.3 million as of June 30, 2026, compared with €59.1 million at the end of June 2025 and €73.2 million at the end of December 2025, reflecting the impact of recent transformation measures as well as the usual seasonality of the Group’s working capital requirements. Gross bank debt amounted to €113.4 million, compared with €109.6 million as of December 31, 2025. As a result, the Group reported net bank debt of €67.1 million at the end of June 2026, compared with €56.1 million at the end of June 2025 and €36.3 million at the end of December 2025. The change during the first half of 2026 reflects the effect of a €-16.0 million decrease in the outstanding balance of receivables assigned under the Group’s non-recourse factoring program, which amounted to €45.3 million at the end of June 2026 (€61.4 million at the end of December 2025 and €62.4 million at the end of June 2025).

After accounting for €46.5 million in lease liabilities (IFRS 16), a sharp decrease compared to the first half of 2025 (€66.0 million), reflecting the streamlining of the vehicle fleet and real estate portfolio amid declining business activity, particularly in France, and €5.5 million in potential financial debt related to earnouts and put options, the Group’s total net debt amounted to €119.0 million at the end of June 2026, down €8.4 million from the €127.4 million recorded on June 30, 2025 (€99.6 million at the end of December 2025).

Following the strategic decision to exit a major framework contract in the French telecommunications market, Solutions30 has initiated the operational adjustments required to align its organisation with its new scope of activities. These adjustments will be completed by the end of 2026, providing the Group with greater visibility over its business portfolio and target operating structure. In parallel, the Group has entered into discussions with its financial partners to reinforce its existing financing arrangements and thereby enable an accelerated repositioning towards its most attractive markets. As these discussions had not been finalized as of the publication date of this press release, there is uncertainty regarding the level of the Group’s short-term financing. However, Management expects these discussions to reach an outcome in the coming weeks.

Outlook

The Group’s transformation will be fully completed by the end of 2026. France will refocus on the energy and technology markets and completely exit its loss-making telecom operations; Germany will build on a stronger and more sustainable customer base. The Benelux region will continue to serve as a foundation for the Group’s profitability, while Other Countries will continue their profitable growth.

Solutions30 will then have a narrower scope but a significantly improved mix of activities and margin profile. The elimination of losses related to the framework agreement in the telecommunications sector in France, the expected recovery of margins in Germany, and the increased weight of the Benelux region should lead to a marked improvement in the Group’s margins.

Having exited contracts that consume financial and human resources, the Group will now focus on several high-growth markets notably in the energy and technology sectors, characterized by the need for on-site intervention, a shortage of technical skills, and a growing demand for outsourcing: low- and medium-voltage power grids, data center services, solar power, battery energy storage, rail infrastructure and satellite broadband. The Group is currently implementing an organizational structure that will enable it to address these markets, which represent key growth drivers for the future.

Webcast for Investors and Analysts

Date: Thursday, September 17, 2026
6:30 PM (CET) – 5:30 PM (GMT)

Speakers:
Gianbeppi Fortis, Chief Executive Officer
Amaury Boilot, Group General Secretary

Connection links:

Webcast in French: https://solutions30.engagestream.euronext.com/resultats-semestriels-2026

Upcoming Events

Strategy Webinar                             Beginning of October 2026 (date to be advised)
2026 Q3 Revenue                            November 5, 2026 (after market close)

About Solutions30 SE

Solutions30 provides consumers and businesses with access to the key technological advancements that are shaping our everyday lives, especially those driving the digital transformation and energy transition. With its network of more than 16,000 technicians, Solutions30 has completed over 65 million call-outs since its inception and led over 500 renewable energy projects. Every day, Solutions30 is doing its part to build a more connected and sustainable world. Solutions30 has become an industry leader in Europe with operations in 9 countries: France, Italy, Germany, the Netherlands, Belgium, Luxembourg, Spain, Portugal, and Poland. The capital of Solutions30 SE consists of 107,127,984 shares, equal to the number of theoretical votes that can be exercised.
Solutions30 SE is listed on the Euronext Paris exchange (ISIN FR0013379484- code S30). Indices: CAC Mid & Small | CAC Small | CAC Technology | Euro Stoxx Total Market Technology | Euronext Tech Croissance.
Visit our website to learn more: www.solutions30.com

Contact

Retail Shareholders:
actionnaires@solutions30.com – Tel: +33 1 86 86 00 63

Analysts/Investors:
investor.relations@solutions30.com

Press:
media.relations@solutions30.com

Revenue

(In millions of euros) Benelux France Germany Other H1 2026
           
Connectivity         139.3                 41.5                 37.6                 56.8                 275.3        
Energy         19.7                 46.2                 3.1                 4.9                 73.8        
Technology         10.2                 32.8                 —                 8.2                 51.2        
Revenue         169.2                 120.6                 40.7                 69.9                 400.3        
           
(In millions of euros) Benelux France Germany Other H1 2025 restated
           
Connectivity         137.4                 71.1                 45.1                 55.7                 309.3        
Energy         31.1                 51.7                 2.2                 4.3                 89.4        
Technology         12.9                 31.4                 —                 7.2                 51.5        
Revenue         181.4                 154.3                 47.3                 67.2                 450.2        

The Group uses financial indicators not defined by IFRS:

– Profitability indicators and their components are key operational performance indicators used by the Group to monitor and evaluate its overall operating earnings and earnings by country.

– Cash flow indicators are used by the Group to implement its investment and resource allocation strategy.

The non-IFRS financial indicators used are calculated as follows:

Organic growth includes the organic growth of acquired companies after they are acquired, which Solutions30 assumes they would not have experienced had they remained independent. In 2025, the Group’s organic growth included only the internal growth of its long-standing subsidiaries.

Adjusted EBITDA is the “operating margin” as reported in the Group’s financial statements.

Free cash flow corresponds to the net cash flow from operating activities less acquisitions of intangible assets; property, plant and equipment; and non-current financial assets.

Calculation of free cash flow:

In millions of euros First half of 2026 H1
2025 restated
Net cash flow from operating activities         (21.5)         (21.5)
Acquisition of fixed assets and non-current financial         (4.5)         (7.3)
Acquisition of fixed assets related to discontinued operations         —                 (0.2)
Disposal of non-current assets after tax         0.5                 —        
Free cash flow         (25.5)         (29.1)

Net free cash flow is equal to free cash flow minus “Repayment of lease debt,” “Repayment of lease debt related to discontinued operations,” “interest paid on lease debt” and “interest paid on lease debt related to discontinued operations” as shown in the Group’s consolidated statement of cash flows.

Calculation of net free cash flow:

In millions of euros 30.06.2026 31.12.2025
Free cash flow         (25.5)         (29.1)
Repayment of lease liabilities         (14.7)         (14.4)
Repayment of lease liabilities related to discontinued operations         —                 (0.3)
Interest paid on lease liabilities         (1.2)         (1.5)
Net free cash flow         (41.3)         (45.3)

Adjusted EBIT corresponds to operating income as shown in the Group’s financial statements, to which “Customer relationship amortization” and “Other non-recurring operating expenses” are added and from which “Other non-recurring operating income” is deducted.

Reconciliation between operating income and adjusted EBIT:

In millions of euros First half of 2026 H1
2025 restated
Operating income         (13.5)                 (8.5)        
Customer relationship amortization         5.1                 6.1        
Other non-recurring operating income         (7.1)                 —        
Other non-recurring operating expenses         9.3                 7.7        
Adjusted EBIT         (6.3)                 5.2        
 As % of revenue         (1.6)        %         1.2        %

Non-current transactions include other income and expenses that are significant in their amount, unusual, and infrequent.

Net debt corresponds to “Debt, long-term,” “Debt, short-term,” and long- and short-term “Lease liabilities” as they appear in the Group’s financial statements from which “Cash and cash equivalents” as they appear in the Group’s financial statements are deducted.

Net debt-to-equity ratio corresponds to “Net debt/Equity.”

Net debt:

In millions of euros 30.06.2026 31.12.2025
Bank debt         113.4                 109.6        
Lease liabilities         46.5                 57.3        
Future liabilities from earnouts and put options         5.5                 6.0        
Cash and cash equivalents         (46.3)                 (73.2)        
Net debt         119.0                 99.6        
     
     
Equity         24.7                 46.9        
% of net debt         482.3        %         212.3        %

Net bank debt corresponds to “Long-term loans from credit institutions” and “Short-term loans from credit institutions, lines of credit, and bank overdrafts” as they appear in note 10.2 of the Group’s annual financial statements from which are deducted “Cash and cash equivalents” as they appear in the Group’s financial statements.

Cash net of bank debt corresponds to “Cash and cash equivalents” as it appears in the Group’s financial statements from which is deducted “Loans from credit institutions, long-term” and “Short-term loans from credit institutions, lines of credit, and bank overdrafts” as they appear in note 10.2 of the Group’s annual financial statements.

Net bank debt:

In millions of euros 30.06.2026 31.12.2025
Loans from credit institutions, long-term         71.2                 76.9        
Short-term loans from credit institutions and lines of credit         42.2                 32.6        
Gross bank debt         113.4                 109.5        
Cash and cash equivalents         (46.3)         (73.2)
Net bank debt         67.1                 36.3        
Cash net of bank debt         (67.1)         (36.3)

Gross bank debt corresponds to “Loans from credit institutions, long-term” and “Short-term loans from credit institutions, lines of credit, and bank overdrafts” as they appear in note 10.2 of the Group’s annual financial statements.

Working capital corresponds to “current assets” as reported in the Group’s financial statements (excluding “Cash and cash equivalents” and “Derivative financial instruments”) less “current liabilities” (excluding “Debt, short-term,” “Current provisions,” and “Lease liabilities”).

Working capital:

In millions of euros 30.06.2026 31.12.2025
Inventory and work in progress         20.8                 22.9        
Trade receivables and related accounts         236.1                 240.9        
Current contract assets         1.0                 1.0        
Other receivables         91.8                 95.9        
Prepaid expenses         2.7                 3.4        
     
Trade payables         (158.0)         (172.2)
Tax and social security liabilities         (166.3)         (166.4)
Other current liabilities         (11.7)         (20.7)
Deferred income         (30.5)         (53.9)
Working capital         (14.1)         (49.1)
     
Change in working capital         34.9                 13.4        
Non-monetary items         (6.6)         4.7        
Change in working capital adjusted for non-monetary items         28.3                 18.1        
     

Net investments correspond to the sum of the lines “Acquisition of current assets,” “Acquisition of non-current assets related to discontinued operations,” “Acquisition of non-current financial assets,” and “Disposal of non-current assets after tax” as they appear in the consolidated statement of cash flows.

Net investments:

In millions of euros First half of 2026 H1
2025 restated
Acquisition of non-current assets         (4.4)         (7.2)
Acquisition of fixed assets related to discontinued operations         —                 (0.2)
Acquisition of non-current financial assets         —                 (0.1)
Disposal of non-current assets after tax         0.5                 —        
Net investments         (3.9)         (7.5)

Expenses related to centralized functions of the Group refer to costs incurred by the parent company’s headquarters functions and are included in the “operating margin.”


1In accordance with the provisions of IFRS 5, the comparative figures for the first half of 2025 income statement have been restated to reflect the classification of the United Kingdom and the divested telecom business in Spain as discontinued operations.

Attachment

Vitry-le-François, France – 17 September 2026, 6:00 p.m. (CEST)

CORE100, Haffner Energy’s C-iC module reservation programme launched seven months ago, is entering a new phase of development, as the offering expands to include integrated, multi-module energy solutions:

  • 38 SYNOCA® C-iC and HYNOCA® C-iC units reserved to date under the programme’s initial scope, covering syngas and hydrogen production projects in Europe and the United States;
  • Launch of a dedicated offering for data centres in August;
  • Expansion of the programme to integrated, multi-module energy solutions for methane and methanol production in early October;
  • Estimated revenue associated with CORE100 increased by more than 60%, from €300 million to over €500 million, while maintaining the same 100-unit cap, reflecting the broader scope of supply for each project;
  • Forecast gross margin generated by CORE100 increased to more than €175 million, from  €90 million at the programme’s launch;
  • Reservation period extended to 31 January 2027, notably to align with the H6 module qualification timetable and the development of the new offerings, with industrial deployment scheduled from March 2027 to March 2030.

In response to market demand for integrated solutions, Haffner Energy is expanding CORE100 to include multi-module offerings covering the entire value chain, from biomass to the final energy carrier. This broader scope increases the programme’s estimated revenue potential to more than €500 million, compared with more than €300 million at launch, while maintaining the same cap of 100 modules over three years. Deliberately set in line with the Company’s industrial ramp-up capacity, this 100-module cap represents a maximum rather than a threshold for the deployment of CORE100.

38 modules already reserved, confirming momentum even before the new offerings’ launch

While the 38 C-iC reservations to date are intended for mono-modular renewable hydrogen or syngas production projects, Haffner Energy has chosen to focus its efforts on developing the new offerings with significantly higher revenue potential per module.

Philippe Haffner, Chairman and Chief Executive Officer of Haffner Energy, said:

“Demand for larger, integrated solutions is strong. We have adapted CORE100 to this market reality without changing either our industrial capacity limit or our modular approach. This expansion of our offering also reconnects us with our historic business: between 1993 and 2020, we designed and delivered large-scale biomass-to-power projects.

The new offering for data centres clearly illustrates this move to a larger scale. Given the size of the projects currently under review, reservation demand could take the programme beyond 100 modules. We are nevertheless maintaining the 100-module cap set for CORE100 in order to manage our industrial scale-up.”

In accordance with the mechanism established when CORE100 was launched, reservations are intended to be converted into firm orders, supported by reciprocal contractual commitments and the payment of deposits, following the end of the reservation period.

Integrated solutions, from biomass to the final energy product

Commercial discussions since the launch of CORE100 have shown that many project developers are seeking solutions covering the entire process, from biomass to the final energy product, beyond hydrogen or syngas production alone.

Haffner Energy is therefore extending its offering to include renewable methane and renewable methanol production, combining its proprietary technologies with complementary, proven equipment supplied by specialist manufacturers. Haffner Energy selects, integrates and supplies this equipment as part of the integrated solution delivered to the customer.

At the same time, several projects currently under review require capacities beyond those of a single module. Haffner Energy is therefore developing multimodular configurations that combine several standardised modules within a single plant, while retaining the industrial benefits of standardisation.

Data centres, a new application for CORE100

The rapid growth in data centres’ energy requirements has led Haffner Energy to develop a new CORE100 offering providing not only dispatchable, resilient, low-carbon and generally cost-competitive electricity, but also the cooling required for servers. The resulting comprehensive, integrated offering draws on Haffner Energy’s 33 years of experience in engineering and technology integration, particularly in producing electricity and cooling from a wide range of biomass feedstocks.

Depending on the required capacity, the configurations developed for data centres may involve several dozen CORE100 modules per project.

Marcella Franchi, Chief Business Development Officer, said:

“Our standardised, multi-module approach enables us to maintain the competitiveness of our solutions while offering our customers greater flexibility and significantly shorter deployment times than a conventional industrial solution. It also provides redundancy: when one module is unavailable, the others continue to operate.

The result is increased availability and enhanced operational reliability – both critical considerations for applications such as data centres, where any interruption can be particularly costly.”

Targeting more than €500 million in revenue and more than €175 million in gross margin

This upward revision results solely from the broader scope of supply associated with each project. For renewable methane and methanol, as well as for data centres, Haffner Energy now integrates the equipment required to deliver the final energy product, a significant proportion of which is supplied by specialist partners. The Company can therefore substantially increase revenue per project without increasing its own industrial capacity and cost base in the same proportions.

Standardisation and higher volumes should also enable Haffner Energy to share engineering and industrialisation costs across a larger number of units, secure more favourable procurement terms and benefit from economies of scale.

About Haffner Energy

Haffner Energy designs and supplies innovative solutions for the production of competitive renewable fuels from biomass. With over 33 years’ experience using all types of biomass, the company has developed proprietary thermolysis and gasification technologies enabling the production of renewable gas, hydrogen, renewable methanol, power, and Sustainable Aviation Fuel (SAF).

As well as supplying technology, Haffner Energy supports its clients in developing industrial projects designed to accelerate the decarbonization of the energy, industrial and transport sectors. Its solutions also contribute to the production of biogenic CO₂ and biochar, thereby supporting the energy transition and the sustainable use of biomass.

Haffner Energy is listed on Euronext Growth (ISIN: FR0014007ND6 – Ticker: ALHAF)

Press contact

Laetitia Mailhes
laetitia.mailhes@haffner-energy.com

Investor contact
investisseurs@haffner-energy.com

Attachment

Primary Mortgage Market Survey®

U.S. weekly average mortgage rates as of 09/17/2026

MCLEAN, Va., Sept. 17, 2026 (GLOBE NEWSWIRE) — Freddie Mac (OTCQB: FMCC) today released the results of its Primary Mortgage Market Survey® (PMMS®), showing the 30-year fixed-rate mortgage (FRM) averaged 6.95%.

“The 30-year fixed-rate mortgage continues to fluctuate as markets assess economic data,” said Sam Khater, Freddie Mac’s Chief Economist.

News Facts

  • The 30-year FRM averaged 6.95% as of September 17, 2026, up from last week when it averaged 6.76%. A year ago at this time, the 30-year FRM averaged 6.26%.
  • The 15-year FRM averaged 6.26%, up from last week when it averaged 6.09%. A year ago at this time, the 15-year FRM averaged 5.41%.

The PMMS® is focused on conventional, conforming, fully amortizing home purchase loans for borrowers who put 20% down and have excellent credit. For more information, view our Frequently Asked Questions.

Freddie Mac’s mission is to make home possible for families across the nation. We promote liquidity, stability and affordability in the housing market throughout all economic cycles. Since 1970, we have helped tens of millions of families buy, rent or keep their home. Learn More: Website | Consumers | X | LinkedIn | Facebook | Instagram | YouTube

MEDIA CONTACT:
Mollie Laniado
(571) 382-1784
Mollie_Laniado@FreddieMac.com

A photo accompanying this announcement is available at https://www.globenewswire.com/NewsRoom/AttachmentNg/87828807-1fa0-4b58-874a-c8fc2a11fec5

PITTSBURGH, PA, September 17, 2026 /3BL/ – Wesco International (NYSE:WCC), a leading provider of business-to-business distribution, logistics services and supply chain solutions, is proud to be Certified™ by Great Place To Work® for the third year in a row. The prestigious award is based entirely on what current employees say about their experience working at Wesco.

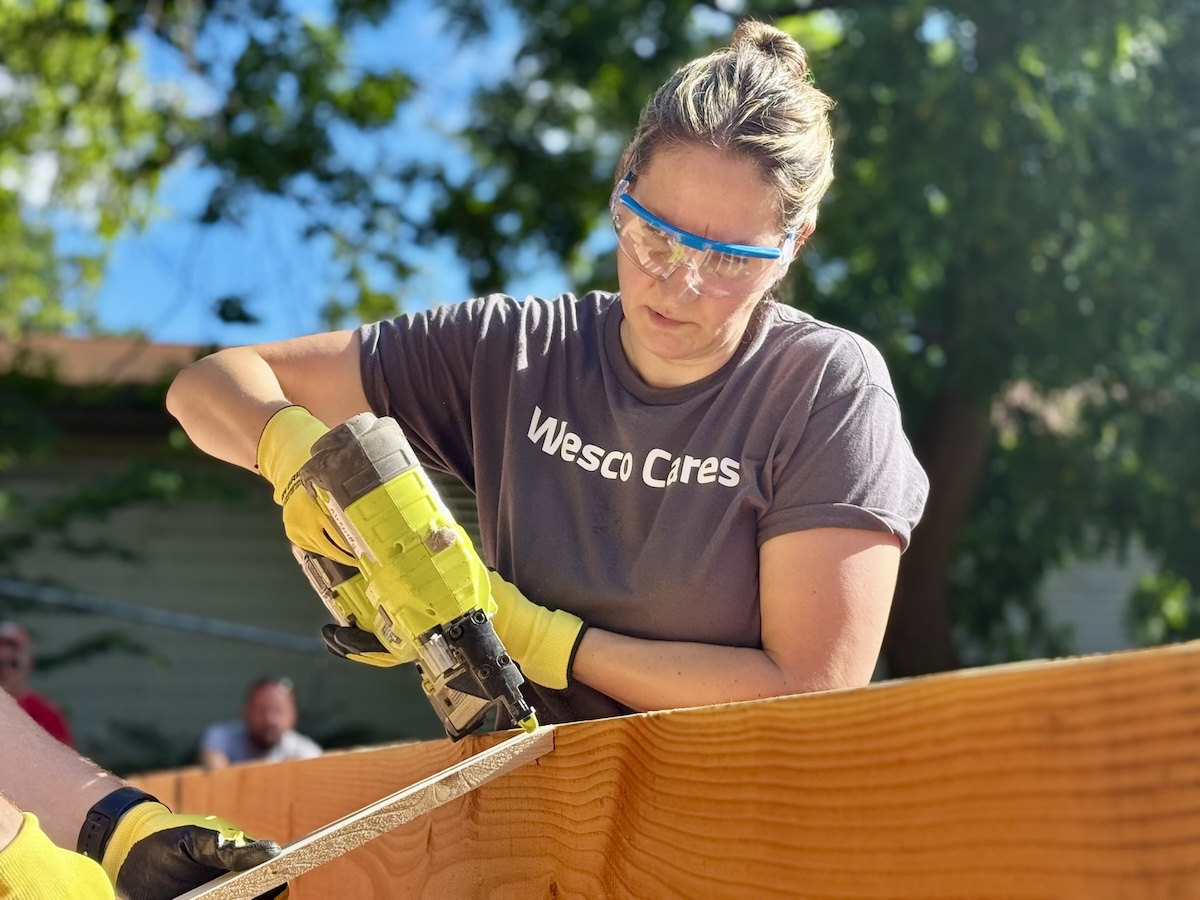
Wesco employee working at Habitat for Humanity site.

This year, 83% of employees who responded to the survey said Wesco is a great place to work, far exceeding the average rating across U.S. companies of 57%.

“As a someone new to the Wesco team, what stands out to me from the survey is the clear connection between our people, our culture and our ability to deliver for our customers,” says Anthony S. Marino, Executive Vice President and Chief Human Resources Officer. “This recognition reflects the strength of our talent and the special environment our teams are building with our leaders – one that helps employees perform at their best and keep the world running.”

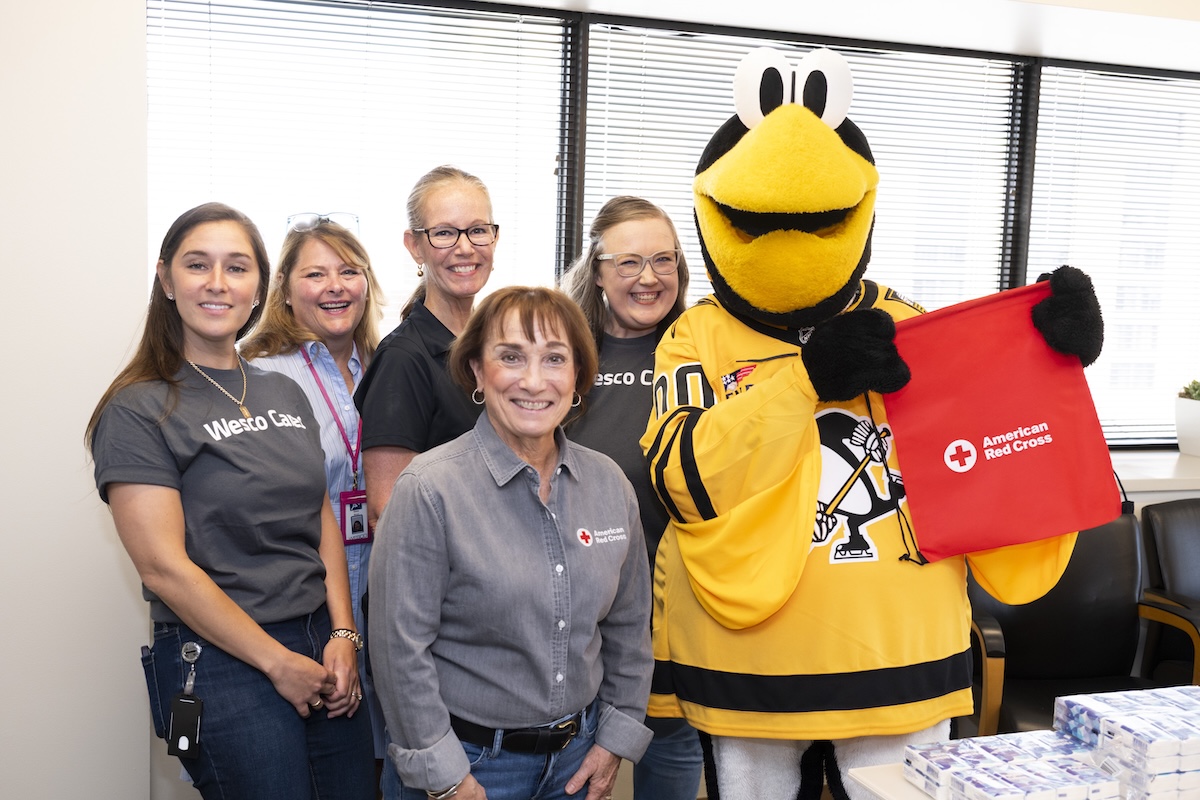
Wesco Team members on the annual Day of Caring.

Wesco’s management team was rated positively by employee survey respondents for treating employees fairly, regardless of race, gender, or sexual orientation, with responses to those statements ranking at 89% or above. In addition, 97% of survey respondents indicated that Wesco is a physically safe place to work. The survey results also indicated that 91% of respondents reported they can take time off work when needed.

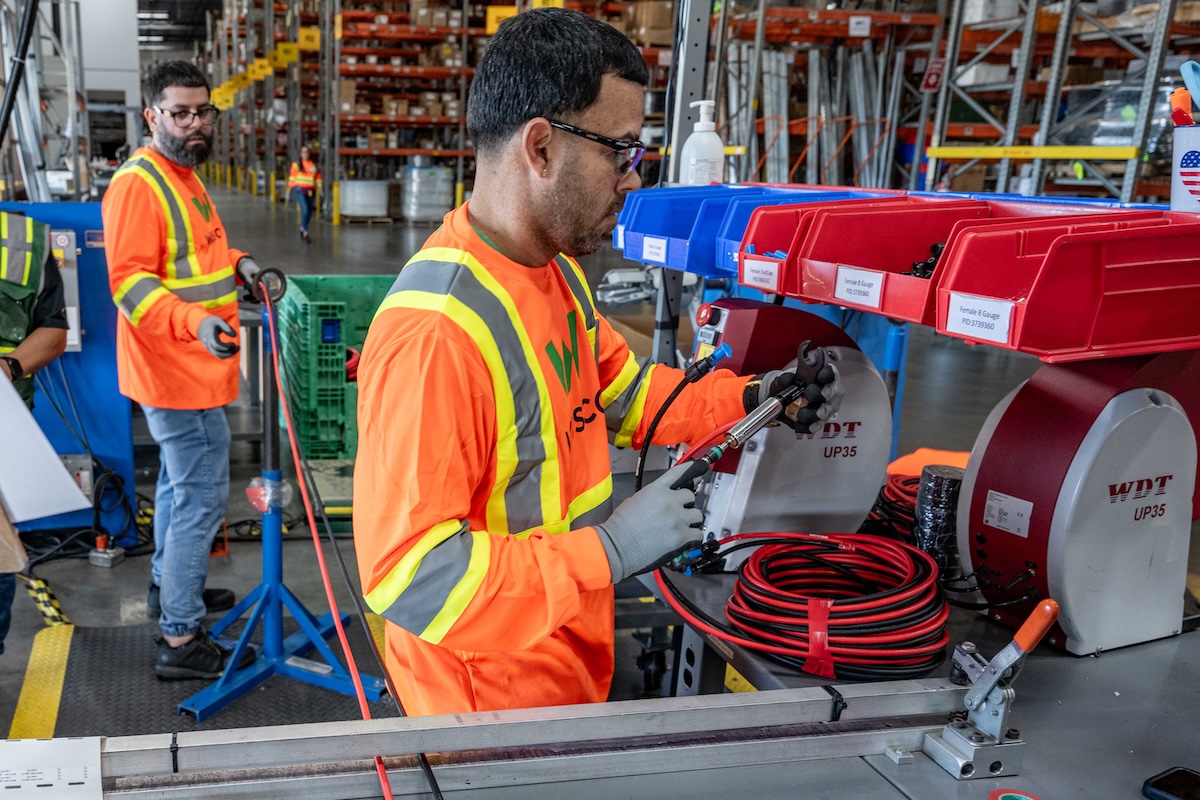
Wesco Team Members working safely in the warehouse facility.

“Great Place To Work Certification is a highly coveted achievement that requires consistent and intentional dedication to the overall employee experience,” says Sarah Lewis-Kulin, the Vice President of Global Recognition at Great Place To Work. She emphasizes that Certification is the sole official recognition earned by the real-time feedback of employees regarding their company culture. “By successfully earning this recognition, it is evident that Wesco stands out as one of the top companies to work for, providing a great workplace environment for its employees.”

Wesco Team members volunteering for a food drive.

You can see more of Wesco’s results at their Great Place To Work Company Profile page here: https://www.greatplacetowork.com/certified-company/1421401

Great Place To Work is the global authority on workplace culture, employee experience, and the leadership behaviors proven to deliver market-leading revenue, employee retention and increased innovation.

According to Great Place To Work research, job seekers are 4.5 times more likely to find a great boss at a Certified great workplace. Additionally, employees at Certified workplaces are 93% more likely to look forward to coming to work.

Explore Wesco’s current job opportunities here: https://www.wesco.com/us/en/our-company/careers.html

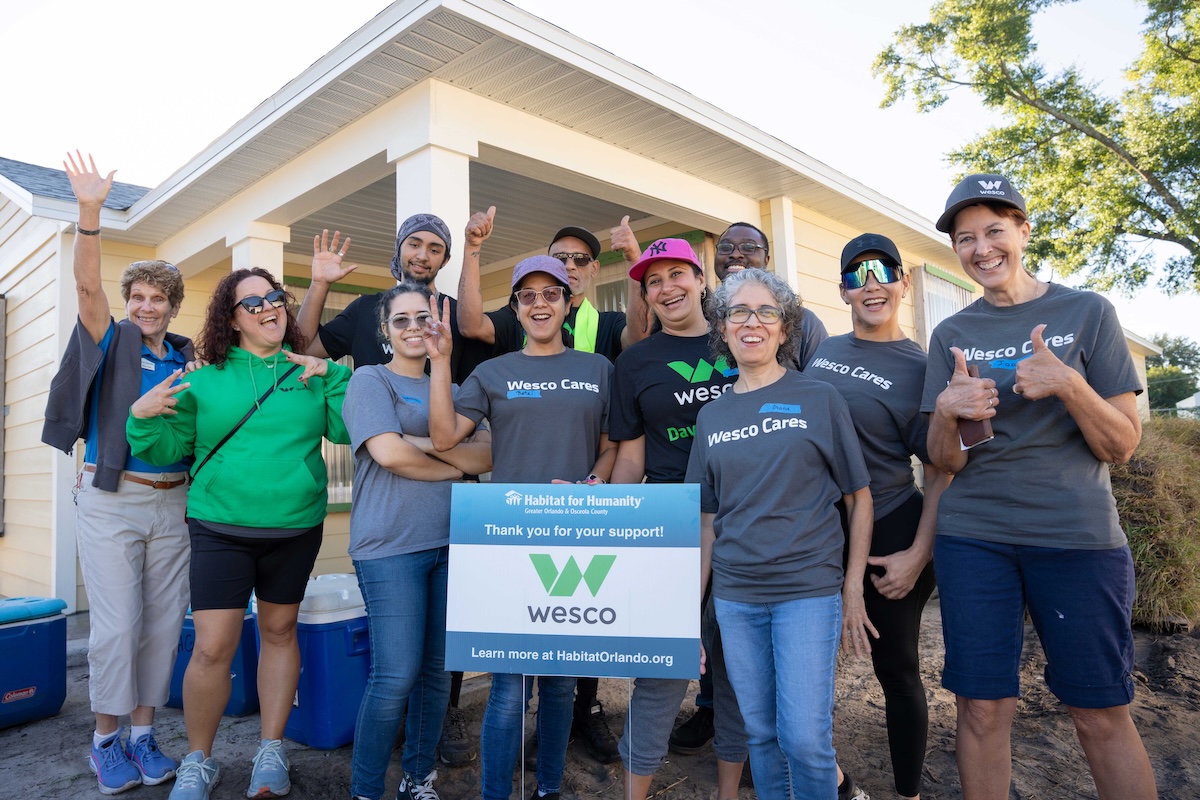
Habitat and Wesco Team at a completed build.

About Wesco

Wesco International (NYSE: WCC) builds, connects, powers and protects the world. Headquartered in Pittsburgh, Pennsylvania, Wesco is a FORTUNE 500® company with approximately $24 billion in annual sales in 2025 and a leading provider of business-to-business distribution, logistics services and supply chain solutions. Wesco offers a best-in-class product and services portfolio of Electrical and Electronic Solutions, Communications and Security Solutions, and Utility and Broadband Solutions. The Company employs approximately 21,000 people, partners with the industry’s premier suppliers, and serves thousands of customers around the world. With millions of products, end-to-end supply chain services, and significant digital capabilities, Wesco provides innovative solutions to meet customer needs across commercial and industrial businesses, technology companies, telecommunications providers, and utilities. Wesco operates more than 700 sites, including distribution centers, fulfillment centers, and sales offices in approximately 50 countries, providing a local presence for customers and a global network to serve multi-location businesses and global corporations.

About Great Place to Work Certification™

Great Place To Work® Certification™ is the most definitive “employer-of-choice” recognition that companies aspire to achieve. It is the only recognition based entirely on what employees report about their workplace experience – specifically, how consistently they experience a high-trust workplace. Great Place to Work Certification is recognized worldwide by employees and employers alike and is the global benchmark for identifying and recognizing outstanding employee experience. Every year, more than 10,000 companies across 60 countries apply to get Great Place To Work-Certified.

About Great Place To Work®

As the global authority on workplace culture, Great Place To Work® brings 30 years of groundbreaking research and data to help every place become a great place to work for all. Their proprietary platform and For All™ Model helps companies evaluate the experience of every employee, with exemplary workplaces becoming Great Place To Work Certified™ or receiving recognition on a coveted Best Workplaces™ List.

Learn more at greatplacetowork.com and follow Great Place To Work on LinkedIn, Twitter, Facebook and Instagram.

Contact
Jennifer Sniderman
Vice President, Corporate Communications
717-579-6603

##


Press release                                                                 Regulated information

Brussels, 17 September 2026, 17:45 CEST

In line with Belgian transparency legislation (Law of May 2, 2007), Citigroup Inc. recently sent to Solvay the following transparency notifications indicating that they crossed the threshold of 3%.

Here is a summary of the notifications:

Date on which the threshold is crossed Voting rights after the transaction Equivalent financial instruments after the transaction Total
September 8, 2026 – – –
September 10, 2026 0.00% 3.07% 3.07%

The latest notification, dated September 15, 2026, contains the following information:

  • Reason for the notification:
    • Acquisition or disposal of financial instruments that are treated as voting securities
  • Notified by: A parent undertaking or a controlling person
  • Date on which the threshold is crossed: September 10, 2026
  • Threshold of direct voting rights crossed: 3% upwards
  • Denominator: 105,876,416
  • Additional information: crossing above 3% which is the lowest threshold per the issuer’s articles of association
  • Persons subject to the notification requirement: Citigroup Inc., 1209 North Orange Street in Wilmington, Delaware 19801, USA

Transparency notifications and the full chain of controlled undertakings through which the holding is effectively held are available on the Investor Relations Section of Solvay’s website.

Contacts

Investor relations

Geoffroy d’Oultremont: +32 478 88 32 96
Vincent Toussaint: +33 6 74 87 85 65
Charlotte Vandevenne: +32 471 68 01 66
investor.relations@solvay.com

Media relations

Peter Boelaert: +32 479 30 91 59
Laetitia Van Minnenbruggen: +32 484 65 30 47
media.relations@solvay.com

About Solvay

Solvay, a pioneering chemical company with a legacy rooted in founder Ernest Solvay’s pivotal innovations in the soda ash process, is dedicated to delivering essential solutions globally through its workforce of around 8,400 employees. Since 1863, Solvay harnesses the power of chemistry to create innovative, sustainable solutions that answer the world’s most essential needs such as purifying the air we breathe and the water we drink, preserving our food supplies, protecting our health and well-being, creating eco-friendly clothing, making the tires of our cars more sustainable and cleaning and protecting our homes. Solvay’s unwavering commitment drives the transition to a carbon-neutral future by 2050, underscoring its dedication to sustainability and a fair and just transition. As a world-leading company with €4.3 billion in net sales in 2025, Solvay is listed on Euronext Brussels and Paris (SOLB). For more information about Solvay, please visit solvay.com or follow Solvay on Linkedin. 

Ce communiqué de presse est également disponible en français.
Dit persbericht is ook in het Nederlands beschikbaar.

Attachments

Press release – Neuilly-sur-Seine, September 17, 2026 – 5.45pm

ARGAN and CELIO inaugurate the extension of the AutOnom® logistics site in Amblainville (60)

A few months after its completion, the extension of CELIO’s logistics site in Amblainville (60) was officially inaugurated in the presence of the Mayor, the President of the Communauté de Communes des Sablons (Sablons Community of Municipalities), the President and shareholders of CELIO France, all site employees, and members of ARGAN’s Management Board.

This inauguration marks a new milestone in the relationship between ARGAN and CELIO, which began nearly fifteen years ago. Already extended in 2017, the Amblainville site now benefits from an additional 12,000 sq.m, bringing its total floor area to 55,000 sq.m. Completed in May 2026, this extension provides CELIO with a logistics facility fully equipped to support its growth and evolving business needs.

A long-standing partnership

Operational since 2012, the Amblainville site now serves as CELIO’s central logistics hub in Europe. Its location, in the immediate proximity of the A16 motorway and at the gateway to the Île-de-France region, makes it a strategic location for the brand.

This new milestone also provides an opportunity to go even further in terms of environmental performance.
The site is now AutOnom®-labelled and features a 400 kWp photovoltaic power plant dedicated to on-site consumption, 250 kWh of battery storage capacity, and heat pumps replacing gas-powered equipment. Together, these measures reduce the site’s CO₂ emissions fourfold, including the extension.

For ARGAN, this latest project fully illustrates its property development model, built around the needs of its tenant-clients. More than just a real estate project, the Amblainville extension is the result of an ongoing dialogue between the two partners, enabling the logistics facility to evolve progressively in line with CELIO’s changing needs.

Stephane Cassagne, Asset Management and Development Director:
“This inauguration is a particularly important milestone for us. It reflects the trust relationship we have built with CELIO over the years. At ARGAN, we believe that being the owner and developer of a warehouse also means supporting our clients over the long term, understanding their challenges, and adapting their real estate capacity as their needs evolve. We are delighted to share this milestone today with the CELIO teams.

ARGAN would like to thank all the teams, partners and local stakeholders who contributed to the success of this project and looks forward to continuing its collaboration with CELIO, a partnership that has now spanned more than a decade.”

2026 financial calendar (Publication of the press release after closing of the stock exchange)

  • October 1: Net sales of 3rd quarter 2026

2027 financial calendar (Publication of the press release after closing of the stock exchange)

  • January 4: Net sales of 4th quarter 2026
  • January 21: Annual results 2026
  • March 25: General Assembly 2027

About ARGAN

ARGAN is the only French real estate company specializing in the DEVELOPMENT & RENTAL OF PREMIUM WAREHOUSES listed on EURONEXT and is the leading player of its market in France. Building on a unique customer-centric approach, ARGAN develops PREMIUM and pre-let Au0nom® -labelled warehouses – i.e., which produce their own energy for self-consumption – for blue-chip companies, with tailor-made services throughout all project phases from the development milestones to the rental management. As at June 30, 2026, ARGAN represented a portfolio of 3.9 million sq.m, with close to 110 warehouses located in the continental area of France. Appraised at a total of €4.3 billion (excl. duties), this portfolio generates a yearly rental income of €224 million (yearly rental income based on the portfolio delivered as at June 30, 2026).
Profitability, well-mastered debt and sustainability are at the heart of ARGAN’s DNA. The financial solidity of the Group’s model is notably reflected in its Investment-grade rating (BBB- with a stable outlook) with Standard & Poor’s. ARGAN is also deploying a committed ESG policy addressing all its stakeholders. Achievements as part of this roadmap are regularly recognized by third-party agencies such as GRESB (rated: 83/100), Sustainalytics (low extra-financial risk), Ethifinance (gold medal) and Ecovadis (silver medal – top 15% amongst rated companies).
ARGAN is a listed real estate investment company (French SIIC), on Compartment A of Euronext Paris (ISIN FR0010481960 – ARG) and is included in the Euronext SBF 120, CAC All-Share, EPRA Europe and IEIF SIIC France indices.

www.argan.fr

Francis Albertinelli – CFO
Aymar de Germay – General Secretary
Samy Bensaid – Head of Investor Relations
Phone: +33 1 47 47 47 40
E-mail: contact@argan.fr


Marlène Brisset – Media relations
Phone: +33 6 59 42 29 35
E-mail: argan@cdrconsultancy.com


Attachment

Regulated Information

Issy-les-Moulineaux, September 17, 2026

Sodexo: Disclosure of transactions in own shares carried out from September 7, 2026 to September 11, 2026

Sodexo purchased treasury shares, outside of its liquidity contract, within the framework of its share buyback program as authorized by the Shareholders’ Meeting held on December 16, 2025.

These shares have been acquired to honor obligations related to free shares award plans.

Information on these transactions are the following:

Trading date LEI ISIN Volume
   (in number of shares)
Weighted average purchase price
(in euros)
Market
07/09/2026 969500AGKR3PRJG4WD05 FR0000121220 10,298 57.6356 XPAR
07/09/2026 969500AGKR3PRJG4WD05 FR0000121220 5,677 57.6148 CEUX
07/09/2026 969500AGKR3PRJG4WD05 FR0000121220 2,173 57.5934 TQEX
07/09/2026 969500AGKR3PRJG4WD05 FR0000121220 665 57.6466 AQEU
08/09/2026 969500AGKR3PRJG4WD05 FR0000121220 5,104 57.3939 CEUX
08/09/2026 969500AGKR3PRJG4WD05 FR0000121220 5,652 57.4041 XPAR
08/09/2026 969500AGKR3PRJG4WD05 FR0000121220 1,770 57.3892 TQEX
08/09/2026 969500AGKR3PRJG4WD05 FR0000121220 1,164 57.3692 AQEU
09/09/2026 969500AGKR3PRJG4WD05 FR0000121220 6,443 57.2455 XPAR
09/09/2026 969500AGKR3PRJG4WD05 FR0000121220 1,408 57.2790 TQEX
09/09/2026 969500AGKR3PRJG4WD05 FR0000121220 8,915 57.2211 CEUX
09/09/2026 969500AGKR3PRJG4WD05 FR0000121220 1,845 57.2528 AQEU
10/09/2026 969500AGKR3PRJG4WD05 FR0000121220 20,626 56.7392 XPAR
10/09/2026 969500AGKR3PRJG4WD05 FR0000121220 18,396 56.7761 CEUX
10/09/2026 969500AGKR3PRJG4WD05 FR0000121220 3,695 56.7976 TQEX
10/09/2026 969500AGKR3PRJG4WD05 FR0000121220 2,684 56.8652 AQEU
11/09/2026 969500AGKR3PRJG4WD05 FR0000121220 1,664 56.3643 AQEU
11/09/2026 969500AGKR3PRJG4WD05 FR0000121220 9,126 56.3290 CEUX
11/09/2026 969500AGKR3PRJG4WD05 FR0000121220 10,664 56.3050 XPAR
11/09/2026 969500AGKR3PRJG4WD05 FR0000121220 2,000 56.2832 TQEX
           
    Total 119 969 56.9579  
           

Detailed information on these transactions may be found on the Sodexo website (https://www.sodexo.com/en/investors/regulated-information).

About Sodexo

Founded in Marseille in 1966 by Pierre Bellon, Sodexo is the leader in Food and Services, shaping better everyday experiences at every moment in life: work, heal, learn and play. The Group stands out for its independence, its founding family shareholding and its responsible business model. With its services, Sodexo meets all the challenges of everyday life with a dual goal: to improve the quality of life of our employees and those we serve, and contribute to the economic, social and environmental progress in the communities where we operate. Our purpose is to create a better everyday for everyone to build a better life for all. Sodexo is included in the CAC Next 20, CAC SBT 1.5, FTSE 4 Good et DJSI indices.

Key Figures

  • 24.1 billion euros Fiscal 2025
    consolidated revenues
  • 426,000 employees as at August 31, 2025
  • #2 France-based private employer worldwide
  • 43 countries
  • 80 million consumers served daily
  • 7.8 billion euro in market capitalization
    (as at July 15, 2026)

Contacts

Investor Relations Corporate Legal
Juliette KLEIN
+33 1 57 75 80 27
juliette.klein@sodexo.com
Olivia GUILLAUME
+33 6 15 20 99 48
olivia.guillaume@sodexo.com

Attachment

Privacy Overview

This website uses cookies so that we can provide you with the best user experience possible. Cookie information is stored in your browser and performs functions such as recognising you when you return to our website and helping our team to understand which sections of the website you find most interesting and useful.