
LONDON–(BUSINESS WIRE)– FORM 8.3 PUBLIC OPENING POSITION DISCLOSURE/DEALING DISCLOSURE BY A PERSON WITH INTERESTS IN RELEVANT SECURITIES REPRESENTING 1% OR MORE Rule 8.3 of the Takeover Code (the “Code”) 1. KEY INFORMATION (a) Full name of discloser: Qube Research & Technologies Limited (b) Owner or controller of interests and short positions disclosed, if different from 1(a): The naming of nominee or vehicle companies is insufficient. For a trust, the trustee(s), settlor and beneficiari
Month: September 2026
FORM 8.5 (EPT/RI)
PUBLIC DEALING DISCLOSURE BY AN EXEMPT PRINCIPAL TRADER WITH RECOGNISED INTERMEDIARY STATUS DEALING IN A CLIENT-SERVING CAPACITY
Rule 8.5 of the Takeover Code (the “Code”)
1. KEY INFORMATION
| (a) Name of exempt principal trader: | Investec Bank Plc |
| (b) Name of offeror/offeree in relation to whose relevant securities this form relates: Use a separate form for each offeror/offeree |
SThree Plc |
| (c) Name of the party to the offer with which exempt principal trader is connected: | Investec is Joint Broker to SThree Plc |
| (d) Date dealing undertaken: | 21st September 2026 |
| (e) In addition to the company in 1(b) above, is the exempt principal trader making disclosures in respect of any other party to this offer? If it is a cash offer or possible cash offer, state “N/A” |
N/A |
2. DEALINGS BY THE EXEMPT PRINCIPAL TRADER
Where there have been dealings in more than one class of relevant securities of the offeror or offeree named in 1(b), copy table 2(a), (b), (c) or (d) (as appropriate) for each additional class of relevant security dealt in.
The currency of all prices and other monetary amounts should be stated.
(a) Purchases and sales
| Class of relevant security | Purchases/ sales | Total number of securities | Highest price per unit paid/received | Lowest price per unit paid/received |
|
Ordinary shares |
Sales |
5,897 |
305.7 | 301.2 |
(b) Cash-settled derivative transactions
| Class of relevant security | Product description e.g. CFD |
Nature of dealing e.g. opening/closing a long/short position, increasing/reducing a long/short position |
Number of reference securities | Price per unit |
| N/A | N/A | N/A | N/A | N/A |
(c) Stock-settled derivative transactions (including options)
(i) Writing, selling, purchasing or varying
| Class of relevant security | Product description e.g. call option | Writing, purchasing, selling, varying etc. | Number of securities to which option relates | Exercise price per unit | Type e.g. American, European etc. |
Expiry date | Option money paid/ received per unit |
| N/A | N/A | N/A | N/A | N/A | N/A | N/A | N/A |
(ii) Exercise
| Class of relevant security | Product description e.g. call option |
Exercising/ exercised against | Number of securities | Exercise price per unit |
| N/A | N/A | N/A | N/A | N/A |
(d) Other dealings (including subscribing for new securities)
| Class of relevant security | Nature of dealing e.g. subscription, conversion |
Details | Price per unit (if applicable) |
| N/A | N/A | N/A | N/A |
3. OTHER INFORMATION
(a) Indemnity and other dealing arrangements
| Details of any indemnity or option arrangement, or any agreement or understanding, formal or informal, relating to relevant securities which may be an inducement to deal or refrain from dealing entered into by the exempt principal trader making the disclosure and any party to the offer or any person acting in concert with a party to the offer: Irrevocable commitments and letters of intent should not be included. If there are no such agreements, arrangements or understandings, state “none” |
|
None |
(b) Agreements, arrangements or understandings relating to options or derivatives
| Details of any agreement, arrangement or understanding, formal or informal, between the exempt principal trader making the disclosure and any other person relating to: (i) the voting rights of any relevant securities under any option; or (ii) the voting rights or future acquisition or disposal of any relevant securities to which any derivative is referenced: If there are no such agreements, arrangements or understandings, state “none” |
| None |
| Date of disclosure: | 22nd September 2026 |
| Contact name: | Priyali Bhattacharjee |
| Telephone number: | +91-9768034903 |
Public disclosures under Rule 8 of the Code must be made to a Regulatory Information Service.
The Panel’s Market Surveillance Unit is available for consultation in relation to the Code’s dealing disclosure requirements on +44 (0)20 7638 0129.
The Code can be viewed on the Panel’s website at ssssssswwww.thetakeoverpanel.org.uk.

VANCOUVER, British Columbia, Sept. 22, 2026 (GLOBE NEWSWIRE) — West Red Lake Gold Mines Ltd. (“West Red Lake Gold” or “WRLG” or the “Company”) (TSXV: WRLG) (OTCQX: WRLGF) is pleased to report drill results from its 100% owned Madsen Mine (the “Madsen Mine” or “Madsen”) located in the Red Lake Mining District of Northwestern Ontario, Canada.
Will Robinson, Vice President of Exploration, commented, “We are pleased to announce another round of impressive assay results from our ongoing underground definition drill program at Madsen. The mineralized panels within the 904 and 955 complexes are holding together quite well with strong grades and continuity demonstrated across multiple areas. These results continue to build our confidence in the geological model and the potential for these areas to be integrated into the Madsen mine plan in 2027. Importantly, these complexes are located close to existing underground infrastructure, with the 904 complex representing non-remnant mineralization, meaning we are now advancing into fresh, previously unmined material, providing additional flexibility as we continue to define and advance mining inventory.”
The results from Austin 904 Complex reported herein were all drilled from the 13 and 14 Levels of the Madsen Mine at approximately 650 metre (“m”) and 700m depth, respectively. These 904 results are in addition to those announced on July 7, 2026 which highlighted 10.22 grams per tonne (“g/t”) gold (“Au”) over 13.35m, and on April 13, 2026 which highlighted 215.46 g/t Au over 5.35m, 50.34 g/t Au over 4.05m and 61.70 g/t Au over 3m, and on February 25, 2026 which highlighted 219.73 g/t Au over 4.8 m, 148.36 g/t Au over 3m and 133.13 g/t Au over 2.5m.
The results from the Austin 955 Complex were drilled from the 12 Level of the Madsen Mine at approximately 600m depth. These 955 results are in addition to those announced on July 7, 2026 which highlighted 43.48 g/t Au over 3.85m and 53.87 g/t Au over 3.1m.
The Austin 904 represents a unique opportunity within the Madsen deposit, comprising an approximately 200m by 200m panel of intact gold mineralization that was not historically mined. This is rare for the Madsen deposit and places WRLG in a favorable position to have full access to the entire mineralized zone for mining which is expected to result in larger stopes and increased efficiency during design and extraction.
DRILLING HIGHLIGHTS:
- Hole MM26D-14-4929-025 intersected 5.3m @ 176.04 g/t Au, including 1m @ 925.52 g/t Au. This intercept was complemented by a large clot of visible gold associated with biotite alteration within a quartz-porphyry dike (Figure 1).
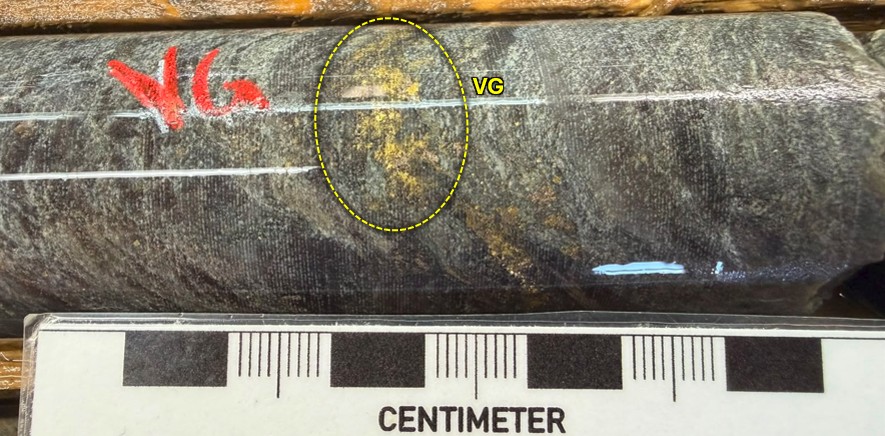
FIGURE 1. Visible gold showing in hole MM26D-14-4929-025 at 64.6m downhole depth.
- Hole MM26D-13-4727-013 intersected 4.5m @ 128.32 g/t Au, including 1m @ 566.81 g/t Au. This intercept was complemented by visible gold associated with pyrrhotite, biotite alteration and quartz-carbonate veining (Figure 2).
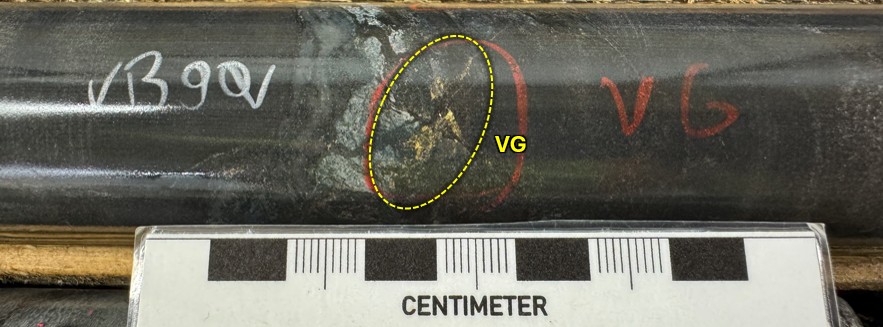
FIGURE 2. Visible gold showing in hole MM26D-13-4727-013 at 139.4m downhole depth.
- Hole MM26D-12-4990-019 intersected 6.85m @ 35.72 g/t Au, including 1m @ 233.76 g/t Au. This intercept was complemented by stringers of visible gold running along foliation (Figure 3).
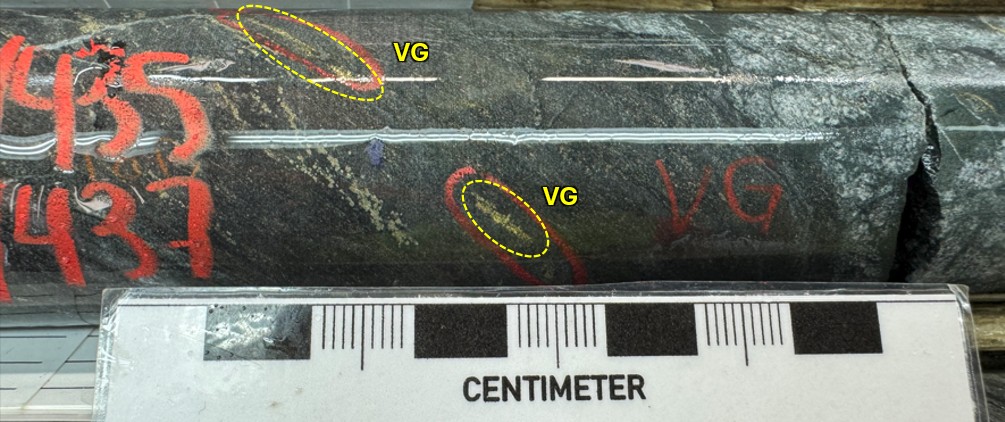
FIGURE 3. Visible gold showing in hole MM26D-12-4990-019 at 74m downhole depth.
- Hole MM26D-14-4929-001 intersected 6.2m @ 17.87 g/t Au, including 3.1m @ 35.02 g/t Au.
- Hole MM26D-12-4990-005 intersected 12.8m @ 7.93 g/t Au, including 7.35m @ 9.69 g/t Au, also including 1.15m @ 11.35 /t Au.
- Hole MM26D-12-4990-007 intersected 11.7m @ 8.09 g/t Au, including 1m @ 59.96 g/t Au.
- Hole MM26D-12-4990-028 intersected 1.9m @ 44.36 g/t Au, including 1.4m @ 59.72 g/t Au.
- Hole MM26D-12-4990-002 intersected 11.15m @ 7.31 g/t Au, including 2m @ 25.75 g/t Au.
- Hole MM26D-12-4990-004 intersected 14.5m @ 5.29 g/t Au, including 2m @ 12.68 g/t Au.
- Hole MM26D-13-4727-002 intersected 4m @ 14.34 g/t Au, including 1m @ 44.71 g/t Au.
TABLE 1. Significant intercepts from drilling at South Austin and Austin 955/904 Complexes.
| Hole ID | Target | From (m) | To (m) | Length (m)* | Au (g/t) |
| MM26D-12-4990-001 | Austin – 955 | 62.00 | 74.00 | 12.00 | 3.00 |
| MM26D-12-4990-002 | Austin – 955 | 58.60 | 69.75 | 11.15 | 7.31 |
| Incl. | 62.00 | 64.00 | 2.00 | 25.75 | |
| MM26D-12-4990-004 | Austin – 955 | 58.00 | 72.50 | 14.50 | 5.29 |
| Incl. | 61.00 | 63.00 | 2.00 | 12.68 | |
| MM26D-12-4990-005 | Austin – 955 | 56.70 | 69.50 | 12.80 | 7.93 |
| Incl. | 56.70 | 64.05 | 7.35 | 9.69 | |
| Also Incl. | 67.00 | 68.15 | 1.15 | 11.35 | |
| MM26D-12-4990-007 | Austin – 955 | 71.30 | 83.00 | 11.70 | 8.09 |
| Incl. | 82.00 | 83.00 | 1.00 | 59.96 | |
| MM26D-12-4990-019 | Austin – 955 | 73.50 | 80.35 | 6.85 | 35.72 |
| Incl. | 74.00 | 75.00 | 1.00 | 233.76 | |
| MM26D-12-4990-020 | Austin – 955 | 85.00 | 87.75 | 2.75 | 13.03 |
| Incl. | 86.00 | 87.00 | 1.00 | 28.13 | |
| MM26D-12-4990-026 | Austin – 955 | 92.05 | 93.50 | 1.45 | 22.41 |
| MM26D-12-4990-028 | Austin – 955 | 90.85 | 92.75 | 1.90 | 44.36 |
| Incl. | 91.35 | 92.75 | 1.40 | 59.72 | |
| MM26D-12-5110-069 | Austin – 955 | 100.00 | 107.00 | 7.00 | 5.32 |
| Incl. | 102.30 | 103.00 | 0.70 | 14.79 | |
| MM26D-12-5110-085 | Austin – 955 | 91.00 | 96.80 | 5.80 | 6.45 |
| Incl. | 94.30 | 94.80 | 0.50 | 32.03 | |
| Also Incl. | 96.30 | 96.80 | 0.50 | 17.51 | |
| MM26D-13-4727-002 | South Austin | 131.00 | 135.00 | 4.00 | 14.34 |
| Incl. | 133.00 | 134.00 | 1.00 | 44.71 | |
| MM26D-13-4727-003 | South Austin | 134.00 | 138.00 | 4.00 | 7.60 |
| Incl. | 134.00 | 135.00 | 1.00 | 25.45 | |
| MM26D-13-4727-004 | South Austin | 163.45 | 168.00 | 4.55 | 9.70 |
| Incl. | 167.25 | 168.00 | 0.75 | 49.13 | |
| MM26D-13-4727-013 | South Austin | 138.50 | 143.00 | 4.50 | 128.32 |
| Incl. | 138.50 | 139.50 | 1.00 | 566.81 | |
| MM26D-13-4727-014 | South Austin | 162.00 | 171.65 | 9.65 | 4.19 |
| Incl. | 167.00 | 167.50 | 0.50 | 11.16 | |
| MM26D-13-5022-039 | Austin – 904 | 147.00 | 155.75 | 8.75 | 4.12 |
| MM26D-13-5022-040 | Austin – 904 | 145.30 | 151.70 | 6.40 | 4.50 |
| Incl. | 147.10 | 147.60 | 0.50 | 17.32 | |
| MM26D-14-4875-004 | Austin – 904 | 54.75 | 56.45 | 1.70 | 15.27 |
| Incl. | 54.75 | 55.25 | 0.50 | 50.07 | |
| AND | Austin – 904 | 60.50 | 62.60 | 2.10 | 11.55 |
| Incl. | 60.50 | 61.15 | 0.65 | 34.17 | |
| MM26D-14-4929-001 | Austin – 904 | 68.80 | 75.00 | 6.20 | 17.87 |
| Incl. | 70.00 | 73.10 | 3.10 | 35.02 | |
| MM26D-14-4929-013 | Austin – 904 | 69.30 | 71.00 | 1.70 | 24.09 |
| Incl. | 70.00 | 71.00 | 1.00 | 36.73 | |
| MM26D-14-4929-021 | Austin – 904 | 89.65 | 92.50 | 2.85 | 15.82 |
| Incl. | 90.15 | 91.00 | 0.85 | 50.57 | |
| MM26D-14-4929-022 | Austin – 904 | 54.45 | 60.10 | 5.65 | 7.91 |
| Incl. | 54.45 | 56.00 | 1.55 | 17.48 | |
| Also Incl. | 57.00 | 58.00 | 1.00 | 13.16 | |
| MM26D-14-4929-025 | Austin – 904 | 63.30 | 68.60 | 5.30 | 176.04 |
| Incl. | 64.30 | 65.30 | 1.00 | 925.52 | |
*The “From-To” intervals in Table 1 are denoting overall downhole length of the intercept. The gold assay results presented are uncapped values. True thickness has not been calculated for these intercepts but is expected to be ≥ 70% of downhole length based on intercept angles observed in the drill core. Internal dilution for composite intervals does not exceed 1m for samples grading <0.1 g/t Au.
TABLE 2: Drill collar summary for holes reported in this News Release.
| Hole ID | Target | Easting | Northing | Elev (m) | Length (m) | Azimuth | Dip |
| MM26D-12-4990-001 | Austin – 955 | 435924 | 5646835 | -149 | 126.0 | 181 | -17 |
| MM26D-12-4990-002 | Austin – 955 | 435925 | 5646835 | -149 | 120.0 | 178 | -12 |
| MM26D-12-4990-004 | Austin – 955 | 435925 | 5646835 | -149 | 117.0 | 175 | -8 |
| MM26D-12-4990-005 | Austin – 955 | 435925 | 5646835 | -149 | 117.0 | 173 | -2 |
| MM26D-12-4990-007 | Austin – 955 | 435925 | 5646835 | -150 | 132.0 | 173 | -17 |
| MM26D-12-4990-019 | Austin – 955 | 435925 | 5646836 | -149 | 120.0 | 162 | -12 |
| MM26D-12-4990-020 | Austin – 955 | 435925 | 5646836 | -149 | 132.0 | 162 | -18 |
| MM26D-12-4990-026 | Austin – 955 | 435925 | 5646836 | -149 | 132.0 | 157 | -17 |
| MM26D-12-4990-028 | Austin – 955 | 435926 | 5646836 | -150 | 130.0 | 154 | -14 |
| MM26D-12-5110-069 | Austin – 955 | 435995 | 5646914 | -147 | 107.0 | 100 | -13 |
| MM26D-12-5110-085 | Austin – 955 | 435994 | 5646913 | -147 | 120.0 | 103 | -11 |
| MM26D-13-4727-002 | South Austin | 435714 | 5646651 | -213 | 171.0 | 114 | 2 |
| MM26D-13-4727-003 | South Austin | 435714 | 5646651 | -213 | 177.0 | 116 | 1 |
| MM26D-13-4727-004 | South Austin | 435713 | 5646651 | -213 | 178.7 | 118 | 2 |
| MM26D-13-4727-013 | South Austin | 435713 | 5646651 | -213 | 172.0 | 122 | 6 |
| MM26D-13-4727-014 | South Austin | 435713 | 5646651 | -213 | 180.0 | 125 | 5 |
| MM26D-13-5022-039 | Austin – 904 | 435922 | 5646869 | -225 | 180.0 | 129 | -15 |
| MM26D-13-5022-040 | Austin – 904 | 435922 | 5646869 | -225 | 180.0 | 132 | -14 |
| MM26D-14-4875-004 | Austin – 904 | 435902 | 5646712 | -245 | 87.0 | 103 | 12 |
| MM26D-14-4929-001 | Austin – 955 | 435928 | 5646756 | -238 | 102.0 | 152 | -10 |
| MM26D-14-4929-013 | Austin – 955 | 435928 | 5646756 | -237 | 84.0 | 139 | 9 |
| MM26D-14-4929-021 | Austin – 955 | 435929 | 5646757 | -239 | 98.6 | 131 | -27 |
| MM26D-14-4929-022 | Austin – 955 | 435929 | 5646757 | -238 | 96.0 | 128 | -3 |
| MM26D-14-4929-025 | Austin – 904 | 435929 | 5646757 | -238 | 111.0 | 124 | -14 |
DISCUSSION
Like the other mineralized domains that comprise the Madsen Mine, the Austin structures are hosted within broad, kilometre-scale planar alteration and deformation corridors that have been repeatedly reactivated during gold mineralization and subsequent deformation and metamorphism.
At the deposit scale the Austin, South Austin, North Austin, and McVeigh Zones are locally folded and structurally dismembered by transposition and rotation into the penetrative S2 Foliation. In addition to this intense deformation overprint, the mineralized veins and alteration have been subjected to the relatively high temperatures of amphibolite facies metamorphism, which led to extensive recrystallization and growth of the skarn-like replacement mineral assemblage of diopside-amphibole-quartz-biotite.
All significant gold mineralization on the mine property is demonstrably early relative to the most significant, penetrative deformation (D2) and metamorphic events. The North Austin Zone displays ‘mine-style’ alteration and mineralization and consists of multiple mineralized domains defined over a strike length of 0.5km. Mineralization remains open at depth and along strike to the northeast.
In drill core, or at underground face exposures, gold-bearing zones at the Madsen Mine are best identified visually by fine (sub-millimetre) grains of free gold within strong alteration and veining. All high-grade intervals generally contain visible gold on drill core exteriors, although numerous examples exist of high-grade assays where visible gold was only identified within the interior (cut surface) of the core samples. Apart from the presence of free gold, pervasive silicification (locally accompanied by discrete quartz veining) and quartz-carbonate or diopside veining are the best indicators that a given interval is within a high-grade zone along/within the mineralized structure.
The current underground drilling program at the Madsen Mine is focused on further definition of near-term mining inventory, as well as growth of the current mineral resource. Drilling has been focused on the more continuous and higher-grade portions of the Austin and South Austin Zones. It is anticipated that this will continue to be the strategy through 2026.
High resolution versions of all the figures contained in this press release can be found at the following web link: WRLG Figures September 22, 2026 News Release.
![WRLG_LongSection_Madsen904Complex[14]](https://ml.globenewswire.com/Resource/Download/ac7542dc-e62f-42cd-901f-ddbabd4534c8/wrlg-longsection-madsen904complex-14-.jpg)
FIGURE 4. Long Section showing drill highlights from current press release in Austin 904 and 955 Complexes with (grade x thickness) at ≥ 25 (g/t Au x m). Interval length denotes downhole core length. True thickness has not been calculated, but is expected to be ≥ 70% of downhole length based on intercept angles observed in the drill core.[1]
[1] Mineral resources are estimated at a cut-off grade of 3.38 g/t Au and a gold price of US1,800/oz. Please refer to the technical report entitled “NI 43-101 Technical Report and Prefeasibility Study for the Madsen Mine, Ontario, Canada”, prepared by SRK Consulting (Canada) Inc. and dated April 30, 2026 with an effective date of January 7, 2025 (the “Madsen Report”). A full copy of the Madsen Report is available on the Company’s website and on SEDAR+ at www.sedarplus.ca.
QUALITY ASSURANCE/QUALITY CONTROL
Drilling completed underground at the Madsen Mine consists of BQ-sized diamond drill core for definition drill programs and oriented NQ-sized diamond drill core for exploration focused drilling. All drill holes are systematically logged, photographed, and sampled by a trained geologist at the Madsen Mine core processing facility. Minimum allowable sample length is 0.5m. Maximum allowable sample length is 1.5m. Control samples (certified standards and uncertified blanks), along duplicates, are inserted at a target 5% insertion rate. Results are assessed for accuracy, precision, and contamination on an ongoing basis. The BQ-sized drill core is whole core sampled. The NQ-sized drill core is then cut lengthwise utilizing a diamond blade core saw along a line pre-selected by the geologist. To reduce sampling bias, the same side of drill core is sampled consistently utilizing the orientation line as reference. For those samples containing visible gold (“VG”), a trained geologist supervises the cutting/bagging of those samples, and ensures the core saw blade is ‘cleaned’ with a dressing stone following the VG sample interval. Bagged samples are then sealed with zip ties and transported by Madsen Mine personnel directly to SGS Natural Resource’s Facility in Red Lake, Ontario for assay.
Samples are then prepped by SGS, which consists of drying at 105°C and crushing to 75% passing 2mm. A riffle splitter is then utilized to produce a 500g course reject for archive. The remainder of the sample is then pulverized to 85% passing 75 microns from which 50g is analyzed by fire assay and an atomic absorption spectroscopy (AAS) finish (SGS Code GO-FAA50V10). Samples returning gold values > 100 g/t Au are reanalyzed by fire assay with a gravimetric finish on a 50g sample (SGS Code GO_FAG50V). Samples with visible gold are also analyzed via metallic screen analysis (SGS code: GO_FAS50M). For multi-element analysis, samples are sent to SGS’s facility in Burnaby, British Columbia and analyzed via four-acid digest with an atomic emission spectroscopy (ICP-AES) finish for 33-element analysis on 0.25g sample pulps (SGS code: GE_ICP40Q12). SGS Natural Resources analytical laboratories operates under a Quality Management System that complies with ISO/IEC 17025.
The Madsen Mine deposit presently hosts a National Instrument 43-101 – Standards of Disclosure for Mineral Projects (“NI 43-101”) Indicated resource of 1.65 million ounces (“Moz”) of gold grading 7.4 g/t Au within 6.9 Mt, and an Inferred resource of 0.37 Moz of gold grading 6.3 g/t Au within 1.8 Mt. Mineral resources are estimated at a cut-off grade of 3.38 g/t Au and a gold price of US$1,800/oz. Mineral resources as stated are inclusive of mineral reserves. Mineral resources that are not mineral reserves do not have demonstrated economic viability. The Madsen Mine also contains Probable reserves of 478 thousand ounces (“koz”) of gold grading 8.16 g/t Au within 1.87 Mt. Mineral reserve estimates are based on a gold price of US$1,680/oz. Please refer to the Madsen Report. The Madsen Resource Estimate has an effective date of December 31, 2021, and excludes depletion of mining activity during the period from January 1, 2022, to the mine closure on October 24, 2022, as it has been deemed immaterial and not relevant for the purpose of the Madsen Report. A full copy of the Madsen Report is available on the Company’s website and on SEDAR+ at www.sedarplus.ca.
The technical information presented in this news release has been reviewed and approved by Will Robinson, P.Geo., Vice President of Exploration for West Red Lake Gold and the Qualified Person for exploration at the West Red Lake Project, as defined by NI 43-101. Mr. Robinson is not independent of WRLG.
High resolution versions of all the figures contained in this press release can be found at the following web link: WRLG Figures September 22, 2026 News Release
ABOUT WEST RED LAKE GOLD MINES
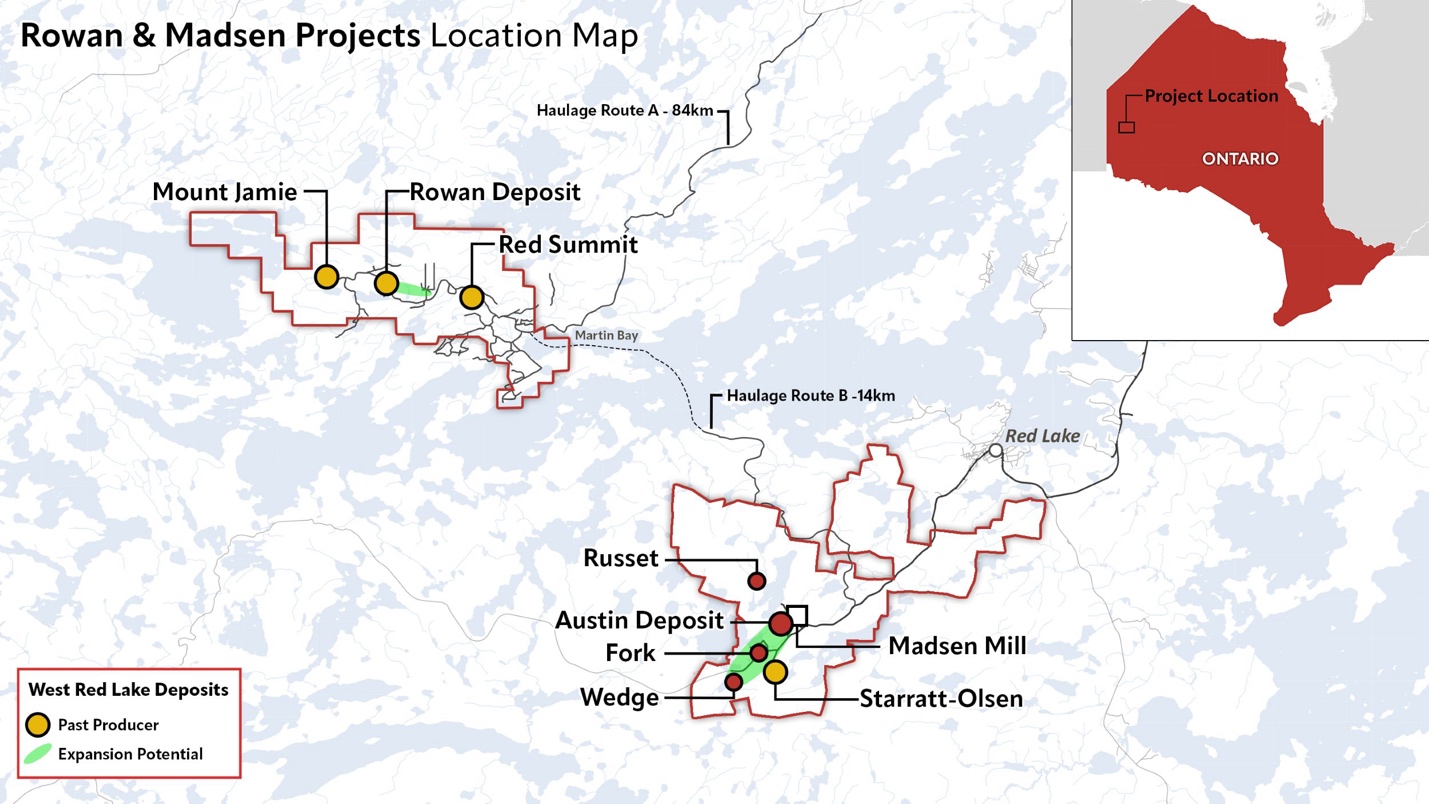
West Red Lake Gold Mines Ltd. is a Canadian gold producer and developer advancing a high-grade, district scale opportunity in the Red Lake district of Ontario. The Company’s flagship Madsen Mine has recently achieved commercial production and is positioned as the central hub of a growing multi asset platform. The Company controls a 47 km² land package in one of the world’s most prolific mining districts, which has historically produced over 20 million ounces of gold from high grade systems1. West Red Lake also owns the Rowan Property in Red Lake, covering 31 km² that includes three past producing mines (Rowan, Mount Jamie and Red Summit) and represents a key source of future production growth.
ON BEHALF OF WEST RED LAKE GOLD MINES LTD.
“Shane Williams”
Shane Williams
President & Chief Executive Officer
FOR FURTHER INFORMATION, PLEASE CONTACT:
Jaclyn Ruptash
V.P. Corporate Communications
Tel: (604) 569-5559
Email: investors@wrlgold.com or visit the Company’s website at https://www.westredlakegold.com
Neither the TSX Venture Exchange nor its Regulation Services Provider (as that term is defined in the policies of the TSX Venture Exchange) accepts responsibility for the adequacy or accuracy of this release.
CAUTIONARY STATEMENT AND FORWARD-LOOKING INFORMATION
Certain statements contained in this news release may constitute “forward-looking information” within the meaning of applicable securities laws. Forward-looking information generally can be identified by words such as “anticipate”, “expect”, “estimate”, “forecast”, “planned”, and similar expressions suggesting future outcomes or events. Forward-looking information is based on current expectations of management; however, it is subject to known and unknown risks, uncertainties and other factors that may cause actual results to differ materially from the forward-looking information in this news release and include without limitation, statements relating to the anticipated impact of the drilling results on actual production at the Madsen Mine; the expectations of results in larger stopes and efficiency at the Madsen Mine; the potential production of mining operations at the Madsen Mine; the further anticipated drilling to occur at Madsen for the remainder of 2026; any untapped growth potential in the Madsen deposit; and the Company’s future objectives and plans. Readers are cautioned not to place undue reliance on forward-looking information.
Forward-looking information involves numerous risks and uncertainties and actual results might differ materially from results suggested in any forward-looking information. These risks and uncertainties include, among other things, market volatility; the state of the financial markets for the Company’s securities; fluctuations in commodity prices; and changes in the Company’s business plans. Forward-looking information is based on a number of key expectations and assumptions, including without limitation, that the Company will continue with its stated business objectives and its ability to raise additional capital to proceed. Although management of the Company has attempted to identify important factors that could cause actual results to differ materially from those contained in forward-looking information, there may be other factors that cause results not to be as anticipated, estimated or intended. There can be no assurance that such forward-looking information will prove to be accurate, as actual results and future events could differ materially from those anticipated in such forward-looking information. Accordingly, readers should not place undue reliance on forward-looking information. Readers are cautioned that reliance on such information may not be appropriate for other purposes. Additional information about risks and uncertainties is contained in the Company’s management’s discussion and analysis for the year ended December 31, 2025, and the Company’s annual information form for the year ended December 31, 2025, copies of which are available on SEDAR+ at www.sedarplus.ca.
The forward-looking information contained herein is expressly qualified in its entirety by this cautionary statement. Forward-looking information reflects management’s current beliefs and is based on information currently available to the Company. The forward-looking information is made as of the date of this news release and the Company assumes no obligation to update or revise such information to reflect new events or circumstances, except as may be required by applicable law.
For more information on the Company, investors should review the Company’s continuous disclosure filings that are available on SEDAR+ at www.sedarplus.ca.
1 Twomey, T. and McGibbon, S. Red Lake Mine, Goldcorp Inc. (2022). “The Geological Setting and Estimation of Gold Grade of the High-Grade Zone, Red Lake Mine.” Exploration Mining Geology, Vol. 10, Nos. 1–2, pp. 19–34. Canadian Institute of Mining, Metallurgy and Petroleum (“CIM”).
Images accompanying this announcement are available at
https://www.globenewswire.com/NewsRoom/AttachmentNg/cd439818-558c-4116-8eec-738ca29afaaa
https://www.globenewswire.com/NewsRoom/AttachmentNg/803f3dcb-6059-4f54-86b8-0543a5afe871
https://www.globenewswire.com/NewsRoom/AttachmentNg/c4f8fbdb-24ae-467d-88cb-035c96886935
https://www.globenewswire.com/NewsRoom/AttachmentNg/ac7542dc-e62f-42cd-901f-ddbabd4534c8
https://www.globenewswire.com/NewsRoom/AttachmentNg/e4b9f98d-d64c-4f55-b481-5ffc63d5f7e3

PHILADELPHIA–(BUSINESS WIRE)– #assetfinance–Odessa appoints Mathew Abraham as CEO. A former COO, he returns to lead growth, innovation, AI investments and global expansion.
FORM 8.5 (EPT/RI)
PUBLIC DEALING DISCLOSURE BY AN EXEMPT PRINCIPAL TRADER WITH RECOGNISED INTERMEDIARY STATUS DEALING IN A CLIENT-SERVING CAPACITY
Rule 8.5 of the Takeover Code (the “Code”)
1. KEY INFORMATION
| (a) Name of exempt principal trader: | Investec Bank Plc |
| (b) Name of offeror/offeree in relation to whose relevant securities this form relates: Use a separate form for each offeror/offeree |
Tribal Group Plc |
| (c) Name of the party to the offer with which exempt principal trader is connected: | Investec is Advisor and Joint Broker to Tribal Group Plc |
| (d) Date dealing undertaken: | 21st September 2026 |
| (e) In addition to the company in 1(b) above, is the exempt principal trader making disclosures in respect of any other party to this offer? If it is a cash offer or possible cash offer, state “N/A” |
N/A |
2. DEALINGS BY THE EXEMPT PRINCIPAL TRADER
Where there have been dealings in more than one class of relevant securities of the offeror or offeree named in 1(b), copy table 2(a), (b), (c) or (d) (as appropriate) for each additional class of relevant security dealt in.
The currency of all prices and other monetary amounts should be stated.
(a) Purchases and sales
| Class of relevant security | Purchases/ sales | Total number of securities | Highest price per unit paid/received | Lowest price per unit paid/received |
|
Ordinary shares |
Purchase |
90,449 |
85 | 82.46 |
|
Ordinary shares |
Sales |
4,610 |
85 | 82.46 |
(b) Cash-settled derivative transactions
| Class of relevant security | Product description e.g. CFD |
Nature of dealing e.g. opening/closing a long/short position, increasing/reducing a long/short position |
Number of reference securities | Price per unit |
| N/A | N/A | N/A | N/A | N/A |
(c) Stock-settled derivative transactions (including options)
(i) Writing, selling, purchasing or varying
| Class of relevant security | Product description e.g. call option | Writing, purchasing, selling, varying etc. | Number of securities to which option relates | Exercise price per unit | Type e.g. American, European etc. |
Expiry date | Option money paid/ received per unit |
| N/A | N/A | N/A | N/A | N/A | N/A | N/A | N/A |
(ii) Exercise
| Class of relevant security | Product description e.g. call option |
Exercising/ exercised against | Number of securities | Exercise price per unit |
| N/A | N/A | N/A | N/A | N/A |
(d) Other dealings (including subscribing for new securities)
| Class of relevant security | Nature of dealing e.g. subscription, conversion |
Details | Price per unit (if applicable) |
| N/A | N/A | N/A | N/A |
3. OTHER INFORMATION
(a) Indemnity and other dealing arrangements
| Details of any indemnity or option arrangement, or any agreement or understanding, formal or informal, relating to relevant securities which may be an inducement to deal or refrain from dealing entered into by the exempt principal trader making the disclosure and any party to the offer or any person acting in concert with a party to the offer: Irrevocable commitments and letters of intent should not be included. If there are no such agreements, arrangements or understandings, state “none” |
|
None |
(b) Agreements, arrangements or understandings relating to options or derivatives
| Details of any agreement, arrangement or understanding, formal or informal, between the exempt principal trader making the disclosure and any other person relating to: (i) the voting rights of any relevant securities under any option; or (ii) the voting rights or future acquisition or disposal of any relevant securities to which any derivative is referenced: If there are no such agreements, arrangements or understandings, state “none” |
| None |
| Date of disclosure: | 22nd September 2026 |
| Contact name: | Priyali Bhattacharjee |
| Telephone number: | +91-9768034903 |
Public disclosures under Rule 8 of the Code must be made to a Regulatory Information Service.
The Panel’s Market Surveillance Unit is available for consultation in relation to the Code’s dealing disclosure requirements on +44 (0)20 7638 0129.
The Code can be viewed on the Panel’s website at ssssssswwww.thetakeoverpanel.org.uk.

Figure 1a VG-NE
Figure 1b VG-NE
Figure 1c VG-NE
Figure 1d VG-NE
Figure 1e VG-NE
Figure 1f VG-NE
Figure 1g VG-NE
Figure 2
Figure 3
Figure 4
Figure 5a
Figure 5b
Figure 6
- 83 holes drilled in 2026 are still pending for assays that should provide a steady stream of news flow into the new year.
- With 48,443 meters drilled in 97 holes utilizing 7 drill rigs turning 24 hours a day for 94 days, the 2026 drill program on Surebet has exceeded expectations with multiple successful large step-out drill holes, maintaining 100% hit rate, and with abundant occurrences of Visible Gold to the Naked Eye (VG-NE); see Figures 1a – 1g.
- Accompanying infographics are available at:
https://www.globenewswire.com/NewsRoom/AttachmentNg/06f88c03-dfe8-4bf6-94e5-a8979b08365e
https://www.globenewswire.com/NewsRoom/AttachmentNg/2a4ec12b-99f5-46ee-b2c0-5ff2a6b905de
https://www.globenewswire.com/NewsRoom/AttachmentNg/c0acd279-f674-48b4-b4cf-45dca3937e13
https://www.globenewswire.com/NewsRoom/AttachmentNg/d4c5958b-d23e-4166-b969-d001328e6cb3
https://www.globenewswire.com/NewsRoom/AttachmentNg/301f8d49-d2d4-4715-85ed-4c387c83d220
https://www.globenewswire.com/NewsRoom/AttachmentNg/eb90bd67-0831-43b9-b296-bbcfcc227cdb
https://www.globenewswire.com/NewsRoom/AttachmentNg/1feb343f-91a9-478f-a619-b7cd5d0d4db4
- Accompanying infographics are available at:
- Over 200,000 meters have been drilled to date at the high-grade Surebet gold discovery, and 412 holes out of 483 (85%) contain VG-NE that clearly demonstrates the continuity and predictability of this expansive gold-rich system that remains wide open; see Figure 2.
- An accompanying infographic is available at:
https://www.globenewswire.com/NewsRoom/AttachmentNg/f1cde5a0-c98d-43f7-91b7-5ccae584d059
- An accompanying infographic is available at:
- The total footprint of the Surebet system is 2.01 km2, which represents a 12% increase compared to 1.8 km2 defined prior to the 2026 drilling season; see news August 24, 2026.
- Goliath’s 2026 drilling successfully expanded Bonanza Zone From 1.27 km2 to 1.51 km2. It intersected mineralization in multiple step-out drill holes, resulting in the expansion of the Bonanza Zone by 750 meters to the southwest, 100 meters to the west, 100 meters to the north and 160 meters to the northeast side of the Surebet system and still remains open for expansion; see Figure 3.
- An accompanying infographic is available at:
https://www.globenewswire.com/NewsRoom/AttachmentNg/236bee17-ba43-4bc6-9d8f-285c9959ec9f
- An accompanying infographic is available at:
- Goliath’s 2026 drilling successfully expanded the Golden Gate Zone from 0.85 km2 To 1.17 km2. It intersected mineralization in multiple step-out drill holes, resulting in the expansion of the Golden Gate Zone by 480 meters to the northeastern side and 540 meters to the southwestern side of the Surebet system; see Figure 4.
- An accompanying infographic is available at:
https://www.globenewswire.com/NewsRoom/AttachmentNg/a3020d19-3d92-4003-97f8-92167541afe3
- An accompanying infographic is available at:
- Goliath’s 2026 drilling successfully identified a new mineralized area including VG-NE, the Big Bulk Zone that is located between the Bonanza and Golden Gate Zone near their juncture, with the central zone extending up to 310 meters in length and 110 meters vertically. This new zone consists of numerous mineralized veinlets stacked for up to 58 meters and hosted in the volcanics that could be amiable to low-cost bulk mining methods; see Figures 5a & 5b.
- The largest helicopter supported drill program in challenging alpine terrain in North America this year has officially come to an end. The throughput was much higher this year even in less than ideal weather conditions and a delayed start due to challenging snow levels compared to the 2025 drill program; a true testament to the leadership and team’s strength.
- High-grade gold has been identified in three distinctive rock types, including: quartz-sulphide breccias and stockwork veins hosted in the sedimentary units; precious and base metals bearing veins hosted in the volcanic units; and intermediate to felsic Eocene-aged dykes. All of which contain substantial amounts of VG-NE (from fine-grained to coarse-grained gold) and remain wide open for expansion. This supports the presence of a Motherlode magmatic source at depth, a causative intrusion responsible for the extensive 2.01 km2 high-grade gold system at Surebet.
- The Surebet Discovery is a grassroots project that has evolved from the idea of exploring prospective untouched ground in an area recently exposed by glacial retreat and snowpack abatement, to a mineralizing system consisting of 46 stacked gold-rich veins defined through over 200,000 meters of drilling, in a total of 21 months of work on the ground.
- The Surebet Discovery has widespread drill holes representing more than 1,500 pierce points (2021-2025) with a vast majority having 25 – 50 meter spacings that would most likely fall into the measured and indicated categories.
- The Company wishes to extend its sincere gratitude to Goliaths senior exploration consultant and project manager Mr. Bill Chornobay for his vision and his entire team for their tireless efforts since 2017. Bill is the founder, team builder, manager and financer of the syndicate responsible for generating, prospecting and staking the Golddigger property including the original Surebet discovery, which was subsequently optioned to Goliath Resources.
TORONTO, Sept. 22, 2026 (GLOBE NEWSWIRE) — Goliath Resources Limited (TSX-V: GOT) (OTCQB: GOTRF) (FSE: B4IF) (the “Company” or “Goliath”) is pleased to announce that the 2026 drill program has concluded with over 48,000 meters drilled in 97 holes at the Surebet Discovery on its 100% owned Golddigger Property (the “Property”), Golden Triangle, British Columbia. The program confirmed the continuity of this large, high-grade, gold-rich system. 100% of the drill holes completed to date on Surebet have intersected quartz-sulphide mineralization, as well, 412 drill holes out of 483 or 85% contain VG-NE, clearly demonstrating the untapped discovery potential remaining on the property. Assays are still pending for 83 holes drilled in 2026.
Mr. Roger Rosmus, Founder & CEO of Goliath states: “Goliath is extremely fortunate to have the guidance and tireless support provided by Mr. Bill Chornobay along with his talented team over many years. They once again successfully completed a significant undertaking in a very short window this year under many adverse conditions including weather and snowpack to mention a few. Under Bill’s guidance, Goliath was able to meet many of its exploration goals over the years including this year and we look forward to another successful year in 2027 under his leadership. The list of people that contributed to the success at Surebet is long, which we are grateful for their tireless efforts that continue to unlock the full potential of the Surebet Discovery. I believe we are nowhere near the limits of this high-grade gold system. As stated many times, the more we drill the bigger the system gets and believe Surebet will be the most significant high-grade gold discoveries in British Columbia’s Golden Triangle in many years. We look forward to releasing further assay results as they are received, interpreted and compiled.”
The 2026 drill program has concluded with over 48,000 meters drilled in 97 holes accomplished in a very short window despite the weather conditions, for a total of over 200,000 meters drilled since the maiden drill program in 2021. This was accomplished with 7 drill rigs in what we understand is one of North America’s largest helicopter-supported drill programs in challenging alpine terrain this year. It is remarkable that 100% of all holes drilled to date have intersected the targeted quartz-sulphide mineralization, 59% of the holes completed in 2026 contain VG-NE and 85% of all 483 holes drilled contain VG-NE. This underscores the excellent predictability and expansive nature of the Surebet discovery that remains open.
High-grade gold has been identified in three distinctive rock types, including: quartz-sulphide breccias and stockwork veins hosted in the sedimentary units; precious and base metals bearing veins hosted in the volcanic units; and intermediate to felsic Eocene-aged dykes. All mineralized rock types contain substantial amounts of VG-NE (from fine-grained to coarse-grained gold) and remain open for expansion. These findings suggest the presence of a large-scale, multi-phased high-grade gold mineralizing event driven by a Motherlode causative intrusion at depth responsible for the extensive 2.01 km2 high-grade gold system at Surebet that remains open.
In just 21 months of on-the-ground work, the Surebet Discovery has advanced from a grassroots showing on virgin ground exposed by glacial and snowpack retreat, to an extensive high-grade gold mineralizing system with significant potential. The project now consists of 46 identified stacked gold-rich veins defined by over 200,000 meters of total drilling. The system’s scale continues to get larger with every drill program, with over 1,500 pierce points (2021 – 2025) distributed across an area of 2.01 km². The consistent high-grade gold results have drawn comparisons to some of the most significant discoveries in the Golden Triangle.
The Company is actively updating its high-grade gold wireframe models as assay results are received. Once all data from the 2026 program has been received, compiled, and modelled, a comprehensive drill plan for the 2027 season will be designed.
Surebet Discovery Highlights
- 100% of the drill holes completed prior to the 2026 drill season have intersected gold mineralization, clearly demonstrating remarkable grade continuity and widths, with over 1,500 diamond drill hole intercepts (pierce points 2021 – 2025); ~77% have 25 – 50 meter spacings. Demonstrating the geological team has a great understanding of the system and its predictability.
- The consistent continuity, widths and grade of ore mineralization demonstrated by >200,000 meters of drilling in multiple stacked lodes/veins confirms that the 2.01 km2 Surebet Discovery continues to demonstrate strong potential to become one of the most significant high-grade gold discoveries in British Columbia’s Golden Triangle in many years.
- The most recent ore mineralization model incorporating all available data prior to the 2026 drill program identified five (5) stacked gold-mineralized vein systems/zones: Bonanza, Surebet, Golden Gate, Whopper, and Eldorado. Collectively these zones comprise 46 gold-rich lodes/veins and multiple subvertical Eocene-aged dyke swarms. A good analogy for the stacked veins that are gently-dipping is the Pogo Mine in Alaska. (see Table 3 and Figure 6).
Table 3: Five main modelled gold rich zones and dykes, see isometric view in Figure 6 below.
| Zone | Number of lodes/veins |
Dimensions | Key Intercept | Status |
| Bonanza | 5 | 1.8 km x 1.8 km x 19 m | 8.35 g/t AuEq over 23 m | Remains Open |
| Surebet | 9 | 1.2 km x 1.0 km x 19 m | 21.08 g/t AuEq over 23 m | Remains Open |
| Golden Gate | 18 | 1.6 km x 1.5 km x 14 m | 34.52 g/t AuEq over 39 m | Remains Open |
| Whopper | 12 | 1.0 km x 1.0 km x 6 m | 32.67 g/t AuEq over 4 m | Remains Open |
| Eldorado | 2 | 1.0 km x 900 m x 5 m | 13.93 g/t AuEq over 5.75 m | Remains Open |
| Gold-rich dykes | 1.4 km x 890 m x 25 m | 12.03 g/t AuEq over 10 m | Remains Open |
- An accompanying infographic is available at: https://www.globenewswire.com/NewsRoom/AttachmentNg/84190ef0-d9a6-4a60-8f51-63d1bb312a38
- 85% of the holes (412 out of 483) drilled to date at the Surebet Discovery contain VG-NE and 100% have intersected quartz-sulphide mineralization. See news releases dated: July 7, 2025, June 23, 2025, January 7, 2025, January 13, 2025, February 10, 2025, February 18, 2025, February 27, 2025, December 12, 2024, July 30, 2024, January 20, 2026, December 2, 2025, November 17, 2025, October 27, 2025, September 22, 2025, September 8, 2025, August 26, 2025, July 28, 2025, July 15, 2026, August 6, 2026, August 10, 2026, August 11, 2026, August 21, 2026, August 24, 2026, August 31, 2026, September 10, 2026, September 16, 2026 and September 18, 2026; see Figure 2 above.
- High-grade gold has been identified in three distinctive rock types, including: quartz-sulphide breccias and stockwork veins hosted in the sedimentary units; precious and base metals bearing veins hosted in the volcanic units; and intermediate to felsic Eocene-aged dykes. All mineralized rock types contain substantial amounts of VG-NE (from fine-grained to coarse-grained gold) and remain open for expansion.
- Metallurgical testing conducted on a composite core sample resulted in metal recoveries of 92.2% for Au, 86.5% for Ag, 94.2% for Pb and 96.9% for Zn achieved through a combination of simple gravity and flotation circuits. The gravity-only recoveries amount to 48.8% Au and 10.3% Ag with a crush size of 327 micrometer (no cyanide leaching required to recover the gold and silver). The metallurgical testing completed to date shows a benign rock composition without deleterious elements (see news release March 1, 2023).
- The best hole drilled to date from the gold-rich stacked quartz-sulphide breccias and stockwork veins hosted in the sedimentary units is GD-23-157 that assayed 21.08 g/t AuEq (18.95 g/t Au and 95.31 g/t Ag) over 23.00 meters, including 33.75 g/t AuEq (30.39 g/t Au and 150.42 g/t Ag) over 14.00 meters, including 50.27 g/t AuEq (45.27 g/t Au and 225.42 g/t Ag) over 9.00 meters (see news release dated August 15, 2023). More details on the QA/QC protocol can be found in the section titled “QA/QC Protocol” below.
- The best hole drilled to date from the precious and base metals bearing veins hosted in the volcanic units is GD-24-260 from the Golden Gate Zone that assayed 34.52 g/t AuEq (34.47 Au and 3.96 Ag) over 39.00 meters, including 132.93 g/t AuEq (132.78 Au and 12.98 Ag) over 10.00 meters, and 166.04 g/t AuEq (165.84 Au and 16.07 Ag) over 8.00 meters (see news release dated January 13, 2025). More details on the QA/QC protocol can be found in the section titled “QA/QC Protocol” below.
- The best hole drilled to date from the Big Bulk Zone, previously reported as the volcanic wedge zone, is GD-24-291 that assayed 1.97 g/t AuEq (1.92 Au and 1.85 Ag) over 33 meters (see news release dated August 31, 2026). This zone is composed of dense networks of thin mineralized veinlets interpreted to represent distributed fractures filled by mineralized fluids within structural interaction damage zones developed around the Bonanza–Golden Gate junctions. More details on the QA/QC protocol can be found in the section titled “QA/QC Protocol” below.
- The best hole drilled to date from the Eocene-aged dykes is GD-22-58 that assayed 12.03 g/t AuEq (11.84 g/t Au and 15.61 g/t Ag) over 10.00 meters including 19.91 g/t AuEq (19.62 g/t Au and 25.61 g/t Ag) over 6.00 meters, including 23.82 g/t AuEq (23.47 g/t Au and 30.54 g/t Ag) over 5.00 meters, plus a second separate interval down hole of 8.59 g/t AuEq (8.35 g/t Au and 20.74 g/t Ag) over 5.00 meters (see news release dated March 13, 2025). More details on the QA/QC protocol can be found in the section titled “QA/QC Protocol” below.
- A study completed by the Colorado School of Mines confirms a new interpretation of the ore forming process at Surebet and suggests a common magmatic source for the high-grade gold system hosted in three distinct rock types. Until this study, researchers and explorers in the Golden Triangle had not recognized the high-grade gold discovery potential in the Eocene-aged dykes (see news release March 13, 2025), which is showing the potential that these discoveries could be a geological breakthrough in the Golden Triangle of British Columbia.
- Based on positive grassroots exploration and drill results in recent years, Goliath now controls 91,518 hectares (226,146 acres), inclusive of 56 kilometers of the Red Line geologic trend providing for additional discovery potential.
- The Golddigger Property is located adjacent to tidewater with a barge route to Prince Rupert (190 km south) and close to existing infrastructure including the town of Kitsault proximal to a permitted mine site on private property.
About Golddigger Property
The Golddigger Property is 100% owned and covers an area of 91,518 hectares in a highly prospective geological setting of the Eskay Rift, within 3 kilometers of the Red Line in the Golden Triangle of British Columbia. This area has hosted some of Canada’s greatest gold mines including Eskay Creek, Premier and Snip. Other significant and well-known deposits in the Golden Triangle include Brucejack, Copper Canyon, Galore Creek, Granduc, KSM, Red Chris, and Schaft Creek. Goliath controls 56 kilometers of the Red Line which is a geologic contact between Triassic age Stuhini rocks and Jurassic age Hazelton rocks used as key markers when exploring for gold-copper-silver mineralization.
The Surebet discovery has shown predictable continuity and good metallurgy with gold recoveries of 92.2% from gravity and flotation at a 327-micrometer crush, including 48.8% recovery of free gold from gravity alone (no cyanide required to recover the gold). The metallurgical testing completed to date shows no presence of deleterious elements (see news release dated March 1, 2023).
The Property is in a well positioned location in close proximity to the communities of Alice Arm and Kitsault where there is a permitted mill site on private property. It is situated adjacent to tide water with direct barge access to Prince Rupert (190 kilometers via the Observatory inlet/Portland inlet). The town of Kitsault is accessible by road (190 kilometers from Terrace, 300 kilometers from Prince Rupert) and has a barge landing, dock, and infrastructure capable of housing at least 300 people, including high-tension power.
Additional infrastructure in the area includes the Dolly Varden Silver Mine Road (only 7 kilometers to the East of the Surebet discovery) with direct road access to Alice Arm barge landing (18 kilometers to the south of the Surebet discovery) and high-tension power (25 kilometers to the east of Surebet discovery). The city of Terrace (population 16,000) provides access to railway, major highways, and airport with supplies (food, fuel, lumber, etc.), while the town of Prince Rupert (population 12,000) is located on the West Coast of British Columbia and houses an international container seaport also with direct access to railway and an airport.
Qualified Person
Mr. Rein Turna P. Geo is the qualified person as defined by National Instrument 43-101, for Goliath Resources Limited projects, and supervised the preparation of, and has reviewed and approved, the technical information in this release. Mr. Turna is an Independent Director of the Company.
About CASERM (Center to Advance the Science of Exploration to Reclamation in Mining)
Goliath Resources is a paying member and active supporter of the Center to Advance the Science of Exploration to Reclamation in Mining (CASERM), which is one of the world’s largest research centers in the mining sector. CASERM is a collaborative research venture between Colorado School of Mines and Virginia Tech that is supported by a consortium of mining and exploration companies, analytical instrumentation and software companies, and federal agencies aiming to transform the way geoscience data is acquired and used across the mining value chain. The center forms part of the I-UCRC program of the National Science Foundation. Research focuses on the integration of diverse geoscience data to improve decision making across the mine life cycle, beginning with the exploration for subsurface resources continuing through mine operation as well as closure and environmental remediation. Over the past three years, Goliath Resources’ membership in CASERM has allowed a high level of research to be performed on the Surebet Discovery.
About Goliath Resources Limited
Goliath Resources is an explorer of precious metals projects in the highly prospective Golden Triangle of Northwestern British Columbia. All of its projects are in high quality geological settings and geopolitical safe jurisdictions amenable to mining in Canada. Goliath is a member and active supporter of CASERM which is an organization that represents a collaborative venture between Colorado School of Mines and Virginia Tech. In 2025, Goliath completed its largest drill program to date for a total of 64,364 meters and has recently completed a fully funded drill program in 2026 comprised of 48,443 meters. The Company’s key strategic cornerstone shareholders include Crescat Capital, a Global Commodity Group (Singapore), McEwen Inc. (NYSE: MUX) (TSX: MUX), Waratah Capital Advisors, Rob McEwen, Eric Sprott and Larry Childress.
For more information please contact:
Goliath Resources Limited
Mr. Roger Rosmus
Founder and CEO
Tel: +1.416.488.2887
roger@goliathresources.com
www.goliathresourcesltd.com
Disclaimer
The reader is cautioned that grab samples are spot samples which are typically, but not exclusively, constrained to mineralization. Grab samples are selective in nature and collected to determine the presence or absence of mineralization and are not intended to be representative of the material sampled.
Quality Assurance / Quality Control (QA/QC) Protocol
Core Samples Handling & Sampling
Oriented HQ-diameter or NQ-diameter diamond drill core from the drill program is placed in core boxes by the drill crew contracted by the Company. Core boxes are transported by helicopter to the staging area and then transported by truck to the core shack. The core is then re-orientated, meterage blocks are checked, meter marks are labelled, Recovery and RQD measurements taken, and primary bedding and secondary structural features including veins, dykes, cleavage, and shears are noted and measured. The core is then described and transcribed in MX DepositTM. Drill holes were planned using Leapfrog Geo™ and QGIS™ software and data from the 2017-2025 exploration programs. Drill core containing quartz breccia, stockwork, veining and/or sulphide(s), or notable alteration is selectively sampled in lengths of 0.5 to 1.5 meters. Samples are selected from continuous intervals of mineralization and/or other relevant geological features, including shoulder samples that extend for 3 meters into adjacent unmineralized and/or unaltered country rock. Along barren core intervals devoid of mineralization or significant geological features, one 1 meter sample is collected every ten meters. Core samples are cut lengthwise in half: one-half remains in the box and the other half is inserted in a clean plastic bag with a sample tag. The bagged samples are then weighed and secured with a zip tie. Certified reference materials (CRMs), blanks and duplicates are added in the sample stream at a rate of 10%. To ensure analytical anonymity, CRM identification labels are removed prior to submission to the laboratory. Additional out-of-sequence blanks are introduced immediately following core samples that contain visible gold to the naked eye (VG-NE) or visibly high-grade sulphide mineralization.
Surface Samples Handling & Sampling
Grab, channels, chip and talus samples were collected by foot with helicopter assistance. Prospective areas included, but were not limited to, proximity to MINFile locations, placer creek occurrences, regional soil anomalies, and potential gossans based on high-resolution satellite imagery. The rock grab and chip samples were extracted using a rock hammer, or hammer and chisel to expose fresh surfaces and to liberate samples weighing anywhere between 0.5 and 5.0 kilograms. All sample sites were flagged with biodegradable flagging tape and marked with the sample number. All sample site locations were recorded using handheld GPS units (accuracy 3-10 meters) and sample ID, easting, northing, elevation, type of sample (outcrop, subcrop, float, talus, chip, grab, etc.) and a description of the rock were recorded on all-weather paper. Samples are then inserted in a clean plastic bag with a sample tag for transport and shipping to the geochemistry lab. QA/QC samples including blanks, certified reference materials, and duplicate samples are inserted regularly into the sample sequence at a rate of 10%.
Samples Analysis
All samples are transported in rice bags sealed with numbered security tags. The rice bags are transported from the core shacks to the MSALABS facilities in Terrace, BC. MSALABS is certified with both AC89-IAS and ISO/IEC Standard 17025:2017. The core samples undergo preparation via drying, crushing to ~70% of the material passing a 2 mm sieve and riffle splitting. The sample splits are weighed and transferred into plastic jars, each containing between 300 g and 500 g of crushed sample material. A 250 g split is pulverized to ensure at least 85% of the material passes through a 75 µm sieve. The crushed samples are transported to the MSALABS PhotonAssayTM facility in Prince George, where gold concentrations are quantified via photon assay analysis (method CPA-Au1). Samples that result in gold concentrations ≥5 ppm are analyzed to extinction. Photon assay uses high-energy X-rays (photons) to excite atomic nuclei within the jarred samples, inducing the emission of secondary gamma rays, which are measured to quantify gold concentrations. The assays from all jars are combined on a weight-averaged basis. Multielement analyses are carried out at the MSALABS facilities in Surrey, BC, where 250 g of pulverized splits are analyzed via IMS-230 and ICF6xx methods. The IMS-230 method uses 4-acid digestion (a combination of hydrochloric, nitric, perchloric and hydrofluoric acids) followed by inductively coupled plasma emission spectrometry to quantify concentrations of 48 elements. Samples with over-limit results for Ag, Cu, Pb and Zn undergo ore-grade analysis via the ICF-6xx method (where ‘xx’ denotes the target metal). This method employs 4-acid digestion followed by inductively coupled plasma emission spectrometry.
Gold Equivalent (AuEq) Calculation
Gold Equivalent (AuEq) values are provided for comparative purposes only and do not include metal recovery factors given that known metallurgical recoveries are only based on preliminary test work and may not be representative of all mineralization styles or zones. Gold Equivalent (AuEq) metal values are calculated using: 4,222.08 Au USD/oz, Ag 67.76 USD/oz, Cu 6.43 USD/lbs, Pb 1,967.13 USD/ton and Zn 3,578.25 USD/ton (updated on August 4, 2026) using the formula below:
There is potential for economic recovery of gold, silver, copper, lead, and zinc based on other mining and exploration projects in the same Golden Triangle Mining Camp where Goliath’s project is located, such as the Homestake Ridge Gold Project (Auryn Resources Technical Report, Updated Mineral Resource Estimate and Preliminary Economic Assessment on the Homestake Ridge Gold Project, prepared by Minefill Services Inc. Bothell, Washington, dated May 29, 2020). Here, AuEq values were calculated using 3-year running averages for metal price, and included provisions for metallurgical recoveries, treatment charges, refining costs, and transportation. Recoveries for Gold were 85.5%, Silver at 74.6%, Copper at 74.6% and Lead at 45.3%. It will be assumed that Zinc can be recovered with Copper at the same recovery rate of 74.6%. The quoted reference of metallurgical recoveries is not from Goliath’s Golddigger Project, Surebet Zone mineralization, and there is no guarantee that such recoveries will ever be achieved, unless detailed metallurgical work such as in a Feasibility Study can be eventually completed on the Golddigger Project.
Reported Drill Intervals and Assays
Drill core intervals are reported as drill lengths, where the true width is estimated to be 80-90% of the length. The widths of the mineralized intervals were defined to reflect both the assay results and the mineralized veining observed in drill core. Veining constrains the local width of the mineralized zone, while assay results define the grade distribution within that zone. Reported intervals are therefore intended to represent geologically meaningful zone widths at the point of intersection.
The reported assays of drill intervals were calculated as length-weighted average grades using the individual sample assay results and their corresponding sample lengths. The average grade for each interval was determined by dividing the sum of the products of each sample grade and sample length by the total sampled interval length (Σ[grade × sample length] / Σ[sample length]). This method accounts for variations in sample length and provides a representative average grade over the reported interval.
Neither the TSX Venture Exchange nor its Regulation Services Provider (as that term is defined in the policies of the TSX Venture Exchange), nor the OTCQB Venture Market accepts responsibility for the adequacy or accuracy of this release.
Certain statements contained in this press release constitute forward-looking information. These statements relate to future events or future performance. The use of any of the words “could”, “intend”, “expect”, “believe”, “will”, “projected”, “estimated” and similar expressions and statements relating to matters that are not historical facts are intended to identify forward-looking information and are based on Goliath’s current belief or assumptions as to the outcome and timing of such future events. Actual future results may differ materially. In particular, this release contains forward-looking information relating to, among other things, the ability of the Company to complete financings and its ability to build value for its shareholders as it develops its mining properties. Various assumptions or factors are typically applied in drawing conclusions or making the forecasts or projections set out in forward-looking information. Those assumptions and factors are based on information currently available to Goliath. Although such statements are based on management’s reasonable assumptions, there can be no assurance that the proposed transactions will occur, or that if the proposed transactions do occur, will be completed on the terms described above.
The forward-looking information contained in this release is made as of the date hereof and Goliath is not obligated to update or revise any forward-looking information, whether as a result of new information, future events or otherwise, except as required by applicable securities laws. Because of the risks, uncertainties and assumptions contained herein, investors should not place undue reliance on forward-looking information. The foregoing statements expressly qualify any forward-looking information contained herein.
This announcement does not constitute an offer, invitation, or recommendation to subscribe for or purchase any securities and neither this announcement nor anything contained in it shall form the basis of any contract or commitment. In particular, this announcement does not constitute an offer to sell, or a solicitation of an offer to buy, securities in the United States, or in any other jurisdiction in which such an offer would be illegal.
The securities referred to herein have not been and will not be registered under the United States Securities Act of 1933, as amended (the “U.S. Securities Act”), or any state securities laws and may not be offered or sold within the United States or to or for the account or benefit of a U.S. person (as defined in Regulation S under the U.S. Securities Act) unless registered under the U.S. Securities Act and applicable state securities laws or an exemption from such registration is available.

BEIJING, Sept. 22, 2026 (GLOBE NEWSWIRE) — Here Group Limited (NASDAQ: HERE) (“Here” or the “Company”), an IP1-based pop toy company dedicated to creating beloved collectibles and trend-defining experiences, today announced its unaudited financial results for the fourth quarter and full year of the fiscal year ended June 30, 2026 (the “fourth quarter of FY 2026”, which refers to the quarter from April 1, 2026 to June 30, 2026, and “FY 2026”, which refers to the year from July 1, 2025 to June 30, 2026).
Highlights for the Fourth Quarter of FY 20262
- Revenues for the fourth quarter of FY 2026 were RMB127.7 million (US$18.8 million), representing a decrease of 22.5% from the third quarter of the fiscal year ended June 30, 2026 (the “third quarter of FY 2026”), and representing an increase of 94.1% from the fourth quarter of the fiscal year ended June 30, 2025 (the “fourth quarter of FY 2025”).
- Net loss from continuing operations for the fourth quarter of FY 2026 was RMB169.6 million (US$25.0 million), including impairment loss on goodwill of RMB124.1 million (US$18.3 million), compared to net loss from continuing operations of RMB34.1 million in the third quarter of FY 2026 and RMB21.8 million in the fourth quarter of FY 2025.
- Adjusted net loss from continuing operations 3 for the fourth quarter of FY 2026 was RMB37.7 million (US$5.6 million), compared to RMB22.9 million in the third quarter of FY 2026 and RMB19.3 million in the fourth quarter of FY 2025.
- As of June 30, 2026, the Company had a total of 22 IPs, including 13 proprietary IPs and 9 exclusively licensed IPs.
Highlights for FY 20262
- Revenues for FY 2026 were RMB596.8 million (US$88.0 million), marking the Company’s first full year of revenue from its pop toy business, compared to RMB65.8 million in the fiscal year ended June 30, 2025 (“FY 2025”, which refers to the year from July 1, 2024 to June 30, 2025).
- Net loss from continuing operations for FY 2026 was RMB254.9 million (US$37.6 million), including impairment loss on goodwill of RMB124.1 million (US$18.3 million), compared with RMB21.8 million in FY 2025.
- Adjusted net loss from continuing operations3 for FY 2026 was RMB93.9 million (US$13.8 million), compared with RMB19.3 million in FY 2025.
Mr. Peng Li, Chairman and Chief Executive Officer of Here, commented, “We closed FY 2026 with fourth quarter revenues of RMB127.7 million, and full-year revenues of RMB596.8 million. FY 2026 was our first full fiscal year focused on the pop toy business, and we made meaningful progress in building the operational foundation and refining our operating model.
In the fourth quarter, we continued to strengthen our self-operated channels through targeted talent acquisition, more refined store operations, ongoing validation of our business model, and continued optimization of our cost structure. At the same time, we expanded our collaboration with channel partners to broaden our distribution network and retail reach. We also enhanced our operational capabilities across multiple formats, including self-operated online and offline stores, pop-up stores, and other retail channels. On the marketing front, we expanded co-branding partnerships with leading brands and increased targeted marketing initiatives, while maintaining cost discipline.
While the market environment remains challenging, we are committed to our IP-first strategy and to delivering high-quality products. We will also optimize cost structure to lay the foundation for profitability over time. We believe these efforts will support sustainable growth and create long-term shareholder value.”
Mr. Dong Xie, Chief Financial Officer, added, “During the quarter, our revenue grew 94.1% year over year but declined sequentially, primarily due to a challenging market environment and lower channel sales. We continued to invest in our self-operated system, including IP development, store operations, and brand promotion. We stayed disciplined in managing costs and expenses and in allocating capital as we further evaluate the unit economics of our various self-operated formats. Looking ahead, we remain committed to strengthening our IP and product capabilities while improving operating efficiency over time.”
Financial Results for the Fourth Quarter of FY 2026
Revenues
Revenues for the fourth quarter of FY 2026 were RMB127.7 million (US$18.8 million), representing a decrease of 22.5% from RMB164.7 million in the third quarter of FY 2026, and an increase of 94.1% from RMB65.8 million in the same period of FY 2025. The quarter-over-quarter decrease was primarily due to the lower channel sales, while the significant year-over-year growth was primarily driven by higher sales across both the Company’s existing IP product lines and its newly launched IP product lines within the pop toy business.
Cost of revenues
Cost of revenues for the fourth quarter of FY 2026 was RMB94.7 million (US$14.0 million), representing a decrease of 12.2% from RMB107.9 million in the third quarter of FY 2026, and an increase of 120.3% from RMB43.0 million in the fourth quarter of FY 2025. The quarter-over-quarter decrease was primarily due to lower channel sales, while the year-over-year increase was primarily attributable to higher IP product costs in line with revenue growth, as well as increases in logistics, labor, and IP licensing expenses.
Sales and marketing expenses
Sales and marketing expenses for the fourth quarter of FY 2026 were RMB56.2 million (US$8.3 million), compared to RMB57.7 million in the third quarter of FY 2026 and representing an increase of 194.3% from RMB19.1 million in the fourth quarter of FY 2025. The year-over-year increase was primarily driven by higher advertising and promotional expenditures and increased employee compensation, reflecting the Company’s continued investment in targeted marketing initiatives for its brands and IP products, as well as the further expansion of its multi-channel sales capabilities.
Research and development expenses
Research and development expenses for the fourth quarter of FY 2026 were RMB9.9 million (US$1.5 million), compared to RMB9.5 million in the third quarter of FY 2026 and representing an increase of 10.3% from RMB9.0 million in the fourth quarter of FY 2025. The year-over-year increase was primarily attributable to product design related expenses, reflecting the Company’s continued investment in the design team, while employee compensation and other service fees remained broadly stable.
General and administrative expenses
General and administrative expenses for the fourth quarter of FY 2026 were RMB25.8 million (US$3.8 million), representing a decrease of 23.2% from RMB33.6 million in the third quarter of FY 2026 and an increase of 31.3% from RMB19.7 million in the fourth quarter of FY 2025. The quarter-over-quarter decrease was primarily attributable to a decrease in salary expenses and share-based compensation expense, while the year-over-year increase was primarily attributable to higher share-based compensation expense.
Impairment loss on goodwill
Impairment loss on goodwill related to the acquisition of Letsvan for the fourth quarter of FY 2026 was RMB124.1 million (US$18.3 million), primarily reflecting lower-than-anticipated financial performance amid macroeconomic headwinds. The gross carrying value of the goodwill arising from the acquisition of Letsvan was RMB187.6 million. After recognizing the impairment charge of RMB124.1 million, the remaining balance of goodwill was RMB63.5 million as of June 30, 2026.
Net loss from continuing operations and adjusted net loss from continuing operations
Net loss from continuing operations was RMB169.6 million (US$25.0 million) in the fourth quarter of FY 2026, compared to RMB34.1 million in the third quarter of FY 2026 and RMB21.8 million in the fourth quarter of FY 2025. Adjusted net loss from continuing operations was RMB37.7 million (US$5.6 million) in the fourth quarter of FY 2026, compared to RMB22.9 million in the third quarter of FY 2026 and RMB19.3 million in the fourth quarter of FY 2025.
Net loss from continuing operations per ordinary share and adjusted net loss from continuing operations per ordinary share4
Basic and diluted net loss from continuing operations per ordinary share were RMB1.07 (US$0.16) in the fourth quarter of FY 2026, compared with basic and diluted net loss from continuing operations per ordinary share of RMB0.21 in the third quarter of FY 2026 and RMB0.12 in the fourth quarter of FY 2025. Basic and diluted adjusted net loss from continuing operations per ordinary share were RMB0.24 (US$0.04) in the fourth quarter of FY 2026, compared with basic and diluted adjusted net loss from continuing operations per ordinary share of RMB0.14 in the third quarter of FY 2026 and RMB0.10 in the fourth quarter of FY 2025.
Financial Results for FY 2026
FY 2025 continuing operations results reflect only the fourth quarter of FY 2025 because the Company’s pop toy business commenced operations in the fourth quarter of FY 2025 following the acquisition of Letsvan by the end of March 2025. The historical results of the Established Business are presented as discontinued operations in accordance with ASC 205-20.
Revenues
Revenues were RMB596.8 million (US$88.0 million) in FY 2026, compared with RMB65.8 million in FY 2025. The year-over-year results of continuing operations are not directly comparable as a result of the FY 2025 discontinued operations presentation described above.
Cost of revenues
Cost of revenues was RMB399.5 million (US$58.9 million) in FY 2026, compared to RMB43.0 million in FY 2025. The year-over-year results of continuing operations are not directly comparable as a result of the FY 2025 discontinued operations presentation described above.
Sales and marketing expenses
Sales and marketing expenses, primarily consisting of advertising and promotional expenditures and employee compensation incurred to enhance product and brand visibility, support customer acquisition, and expand the Company’s market presence, were RMB194.4 million (US$28.6 million) in FY 2026, compared to RMB19.1 million in FY 2025. The year-over-year results of continuing operations are not directly comparable as a result of the FY 2025 discontinued operations presentation described above.
Research and development expenses
Research and development expenses, primarily consisting of expenses supporting innovation across the Company’s pop toy portfolio, including the design and development of new products, were RMB44.3 million (US$6.5 million) in FY 2026, compared to RMB9.0 million in FY 2025. The year-over-year results of continuing operations are not directly comparable as a result of the FY 2025 discontinued operations presentation described above.
General and administrative expenses
General and administrative expenses, primarily consisting of costs supporting the Company’s core operational functions, including employee compensation, professional service fees, and other operational expenses, were RMB128.9 million (US$19.0 million) in FY 2026, compared to RMB19.7 million in FY 2025. The year-over-year results of continuing operations are not directly comparable as a result of the 2025 discontinued operations presentation described above.
Impairment loss on goodwill
Impairment loss on goodwill related to the acquisition of Letsvan was RMB124.1 million (US$18.3 million) in FY 2026, primarily reflecting lower-than-anticipated financial performance amid macroeconomic headwinds.
In performing the quantitative impairment test, the Group used an income approach based on a discounted cash flow model (“DCF model”) and compared the fair value of the reporting unit with its carrying amount, including goodwill. Forecasts of future cash flows are based primarily on the management’s best estimate and management believes forecasted operating cash flows were the best indicator of the fair value of the reporting unit. A number of significant assumptions were involved in the preparation of the DCF models, including future revenues and discount rates. Changes in these forecasts could significantly change the amount of impairment recorded. Therefore, it may be necessary to record further impairment charges to these reporting units in the future, if any changes occur.
Net loss from continuing operations and adjusted net loss from continuing operations
Net loss from continuing operations was RMB254.9 million (US$37.6 million) in FY 2026, compared to RMB21.8 million in FY 2025. Adjusted net loss from continuing operations was RMB93.9 million (US$13.8 million) in FY 2026, compared to RMB19.3 million in FY 2025.
Net loss from continuing operations per ordinary share and adjusted net loss from continuing operations per ordinary share4
Basic and diluted net loss from continuing operations per ordinary share were RMB1.59 (US$0.23) in FY 2026, compared with basic and diluted net loss from continuing operations per ordinary share of RMB0.12 in FY 2025. Basic and diluted adjusted net loss from continuing operations per ordinary share were RMB0.59 (US$0.09) in FY 2026, compared with basic and diluted adjusted net loss from continuing operations per ordinary share of RMB0.11 in FY 2025.
Recent Developments
2026 Share Repurchase Program
On June 5, 2026, the Company announced that the Board of Directors (the “Board”) had approved a new share repurchase program, pursuant to which the Company may repurchase up to US$20.0 million of its Class A ordinary shares in the form of American depositary shares (“ADSs”) during the period from July 1, 2026 through June 30, 2027 (the “2026 Share Repurchase Program”).
As of September 16, 2026, the Company had repurchased approximately 0.4 million ADSs for aggregate consideration of approximately US$0.7 million under the 2026 Share Repurchase Program.
Changes in Composition of Board and Management
Ms. Liu Xihao, a member of the Company’s Board and Senior Vice President, has resigned from the Board and stepped down from her position as Senior Vice President for personal reasons, effective September 22, 2026. Ms. Liu Xihao’s decision to resign from the Board and step down from her position as Senior Vice President was not the result of any disagreement with the Company, the Board, any committee of the Board, or the Company’s management regarding the Company’s operations, policies or practices.
Ms. Liu Xihao has been a valued member of the Company’s executive team and has contributed significantly to the Company’s achievements during her tenure. Ms. Liu Xihao’s decision to resign was made in order to pursue new professional opportunities aligned with her professional aspirations. The Company respects her decision and wishes her every success in her future endeavors.
Conference Call Information
The Company’s management will hold an earnings conference call at 07:00 A.M. Eastern Time on September 22, 2026 (07:00 P.M. Beijing Time on the same day) to discuss the financial results. Details for the conference call are as follows:
Event Title: Here Group Limited Q4 and Full FY2026 Earnings Call
Pre-register Link: https://dpregister.com/sreg/10211876/104db963664
All participants may use the link provided above to complete the online registration process in advance of the conference call. Upon registration, each participant will receive an email with a set of participant dial-in numbers, a passcode, and a unique PIN to join the conference call.
| The replay will be accessible through September 29, 2026 by dialing the following numbers: | |
| International: United States Toll Free: Replay Access Code: |
1-412-317-0088 1-855-669-9658 1800829 |
A live and archived webcast of the conference call will also be available at the Company’s investor relations website at https://ir.heregroup.com.
Non-GAAP Financial Measures
To supplement the Company’s consolidated financial statements, which are prepared and presented in accordance with U.S. GAAP, the Company uses adjusted net loss from continuing operations and basic and diluted adjusted net loss from continuing operations per ordinary share as its non-GAAP financial measures. Adjusted net loss from continuing operations represents net loss from continuing operations excluding share-based compensation expense and impairment loss on goodwill. Basic and diluted adjusted net loss from continuing operations per ordinary share represents adjusted net loss from continuing operations attributable to Here Group Limited divided by weighted average number of ordinary shares outstanding during the periods used in computing adjusted net loss from continuing operations per ordinary share, basic and diluted. The Company believes that the non-GAAP financial measures provide useful information about the Company’s results of operations, enhance the overall understanding of the Company’s past performance and future prospects and allow for greater visibility with respect to key metrics used by the Company’s management in its financial and operational decision-making.
The non-GAAP financial measures are not defined under U.S. GAAP and are not presented in accordance with U.S. GAAP. The non-GAAP financial measures have limitations as analytical tools, and when assessing the Company’s operating performance, investors should not consider them in isolation, or as a substitute for net loss from continuing operations, net loss from continuing operations per ordinary share, basic and diluted or other consolidated statements of operations data prepared in accordance with U.S. GAAP. The Company’s definition of non-GAAP financial measures may differ from those of industry peers and may not be comparable with their non-GAAP financial measures.
The Company mitigates these limitations by reconciling the non-GAAP financial measures to the most comparable U.S. GAAP performance measures, all of which should be considered when evaluating the Company’s performance. For more information on these non-GAAP financial measures, please see the table captioned “Here Group Limited Unaudited Reconciliation of GAAP and Non-GAAP Results” near the end of this release.
Exchange Rate Information
This announcement contains translations of certain Renminbi (“RMB”) amounts into U.S. dollars (“US$”) at specified rates solely for the convenience of the reader. Unless otherwise stated, all translations from Renminbi to U.S. dollars were made at the rate of RMB6.7851 to US$1.00, the exchange rate on June 30, 2026, set forth in the H.10 statistical release of the Federal Reserve Board. The Company makes no representation that the Renminbi or U.S. dollars amounts referred to could be converted into U.S. dollars or Renminbi, as the case may be, at any particular rate or at all.
Safe Harbor Statements
This announcement contains forward-looking statements within the meaning of Section 27A of the Securities Act of 1933, as amended and Section 21E of the Securities Exchange Act of 1934, as amended and the Private Securities Litigation Reform Act of 1995. All statements other than statements of historical or current fact included in this press release are forward-looking statements, including but not limited to statements regarding the Company’s financial outlook, beliefs and expectations. These statements can be identified by terminology such as “will,” “expects,” “anticipates,” “future,” “intends,” “plans,” “believes,” “estimates,” “potential,” “continue,” “ongoing,” “targets,” “guidance” and similar statements. The Company may also make written or oral forward-looking statements in its periodic reports to the U.S. Securities and Exchange Commission (the “SEC”), in its annual report to shareholders, in press releases, and other written materials and in oral statements made by its officers, directors or employees to third parties. Forward-looking statements involve inherent risks and uncertainties. A number of factors could cause actual results to differ materially from those contained in any forward-looking statement, including but not limited to the following: the Company’s growth strategies; its future business development, results of operations and financial condition; its ability to attract and retain new consumers and to increase the spending and revenues generated from consumers; its ability to maintain and enhance the recognition and reputation of its brands; its expectations regarding demand for and market acceptance of its services and products; expected growth, future trends and competition in the markets that it operates in; changes in its revenues and certain cost or expense items; PRC governmental policies and regulations relating to its business lines and industries, general economic and political conditions in China and globally, and assumptions underlying or related to any of the foregoing. Further information regarding these and other risks, uncertainties, or factors is included in the Company’s filings with the SEC. You are cautioned not to place undue reliance on these forward-looking statements, which speak only as of the date this press release. All forward-looking statements are qualified in their entirety by this cautionary statement, and the Company undertakes no obligation to revise or update any forward-looking statements to reflect events or circumstances after the date hereof.
About the Company
The Company, through its HERE奇梦岛 brand, creates collectible pop toys that spark joy and inspire global culture. With innovative design and storytelling at its core, the Company delivers immersive experiences that connect deeply with collectors worldwide. Guided by joy, integrity, wonder, and co-creation, the Company is building vibrant cultural ecosystems where fans shape and share dreams.
For more information, please visit: https://ir.heregroup.com.
Contact
Investor Relations
Tina Tang
Here Group Limited
Email: ir@heregroup.com
Tel: +852 2988-8279
Robin Yang, Partner
ICR, LLC
Email: Heregroup.IR@icrinc.com
Phone: +1 (212) 537-0429
____________________________
1 “IP” refers to the design of a single or a series of characters and the underlying intellectual property rights.
2 As previously reported, the Company completed the disposal of its Established Business (all the business operations established prior to the acquisition of Shenzhen Yiqi Culture Co., Ltd. (“Letsvan”), including the individual online learning services business, consumer businesses and other businesses aside from the pop toy business) on September 30, 2025. As the disposal met the definition of discontinued operations in accordance with ASC 205-20, the historical financial results of the Established Business were reflected in the Company’s consolidated financial statements as discontinued operations, and the related assets and liabilities associated with discontinued operations in the prior year consolidated balance sheets were classified as assets/liabilities held for sale.
3 Adjusted net loss from continuing operations is a non-GAAP financial measure. For a reconciliation of net loss from continuing operations to adjusted net loss from continuing operations, see the “Non-GAAP Financial Measures” section and the table captioned “Here Group Limited Unaudited Reconciliation of GAAP and Non-GAAP Results” below.
4 Basic and diluted adjusted net loss from continuing operations per ordinary share are non-GAAP financial measures. For a reconciliation of basic and diluted net loss from continuing operations per ordinary share to basic and diluted adjusted net loss from continuing operations per ordinary share, see the “Non-GAAP Financial Measures” section and the table captioned “Here Group Limited Unaudited Reconciliation of GAAP and Non-GAAP Results” below.
| HERE GROUP LIMITED UNAUDITED CONDENSED CONSOLIDATED BALANCE SHEETS (Amounts in thousands, except for share and per share data) |
|||||
| As of | |||||
| June 30, 2025 |
June 30, 2026 |
June 30, 2026 |
|||
| RMB | RMB | US$ | |||
| ASSETS | |||||
| Current assets: | |||||
| Cash and cash equivalents | 472,943 | 431,061 | 63,531 | ||
| Restricted cash | 20,757 | 1,043 | 154 | ||
| Short-term investments | 139,990 | 178,223 | 26,267 | ||
| Accounts receivable, net | 29,505 | 16,860 | 2,485 | ||
| Amounts due from related parties | 1,577 | 26,231 | 3,866 | ||
| Inventory, net | 16,229 | 134,744 | 19,859 | ||
| Prepayments and other current assets | 73,434 | 124,018 | 18,277 | ||
| Current assets held for sale | 558,316 | – | – | ||
| Total current assets | 1,312,751 | 912,180 | 134,439 | ||
| Non-current assets: | |||||
| Property and equipment, net | 9,935 | 22,366 | 3,296 | ||
| Intangible assets, net | 65,938 | 61,225 | 9,023 | ||
| Long-term investments | 28,254 | 20,362 | 3,001 | ||
| Operating lease right-of-use assets | 12,504 | 35,438 | 5,223 | ||
| Goodwill | 187,598 | 63,539 | 9,364 | ||
| Other non-current assets | 1,475 | 21,723 | 3,202 | ||
| Non-current assets held for sale | 43,064 | – | – | ||
| Total non-current assets | 348,768 | 224,653 | 33,109 | ||
| TOTAL ASSETS | 1,661,519 | 1,136,833 | 167,548 | ||
| LIABILITIES | |||||
| Current liabilities: | |||||
| Short-term borrowings | 11,100 | – | – | ||
| Accounts payable | 14,321 | 53,709 | 7,916 | ||
| Accrued expenses and other current liabilities | 66,168 | 49,445 | 7,287 | ||
| Amounts due to related parties | 3,321 | 17,637 | 2,599 | ||
| Income tax payable | 9,440 | 5,430 | 800 | ||
| Contract liabilities | 1,665 | 7,111 | 1,048 | ||
| Operating lease liabilities, current portion | 9,482 | 18,532 | 2,731 | ||
| Current liabilities held for sale | 498,516 | – | – | ||
| Total current liabilities | 614,013 | 151,864 | 22,381 | ||
| Non-current liabilities: | |||||
| Operating lease liabilities, non-current portion | 4,617 | 16,248 | 2,395 | ||
| Deferred tax liabilities | 72,014 | 118,630 | 17,484 | ||
| Non-current liabilities held for sale | 37,912 | – | – | ||
| Total non-current liabilities | 114,543 | 134,878 | 19,879 | ||
| TOTAL LIABILITIES | 728,556 | 286,742 | 42,260 | ||
| HERE GROUP LIMITED UNAUDITED CONDENSED CONSOLIDATED BALANCE SHEETS – continued (Amounts in thousands, except for share and per share data) |
||||||||
| As of | ||||||||
| June 30, 2025 |
June 30, 2026 |
June 30, 2026 |
||||||
| RMB | RMB | US$ | ||||||
| MEZZANINE EQUITY | ||||||||
| Non-controlling interests | 40,999 | 221,372 | 32,626 | |||||
| SHAREHOLDERS’ EQUITY | ||||||||
| Class A ordinary shares | 81 | 81 | 12 | |||||
| Class B ordinary shares | 34 | 34 | 5 | |||||
| Treasury stock | (49,054 | ) | (121,020 | ) | (17,836 | ) | ||
| Additional paid-in capital | 1,066,860 | 900,672 | 132,743 | |||||
| Accumulated other comprehensive income | 16,507 | 11,950 | 1,761 | |||||
| Accumulated deficit | (225,431 | ) | (162,998 | ) | (24,023 | ) | ||
| TOTAL HERE GROUP LIMITED SHAREHOLDERS’ EQUITY | 808,997 | 628,719 | 92,662 | |||||
| Non-controlling interests | 82,967 | – | – | |||||
| TOTAL SHAREHOLDERS’ EQUITY | 891,964 | 628,719 | 92,662 | |||||
| TOTAL LIABILITIES, MEZZANINE EQUITY AND SHAREHOLDERS’ EQUITY | 1,661,519 | 1,136,833 | 167,548 | |||||
| HERE GROUP LIMITED UNAUDITED CONDENSED CONSOLIDATED STATEMENTS OF OPERATIONS AND COMPREHENSIVE LOSS (Amounts in thousands, except for share and per share data) |
||||||||||||||||||||
| For the Three Months Ended |
For the Years Ended |
|||||||||||||||||||
| June 30, 2025 |
March 31, 2026 | June 30, 2026 |
June 30, 2026 |
June 30, 2025 |
June 30, 2026 |
June 30, 2026 |
||||||||||||||
| RMB | RMB | RMB | US$ | RMB | RMB | US$ | ||||||||||||||
| Revenues(including revenues from one related party of RMB1,503, RMB3,795 and RMB12,039 for the three months ended June 30, 2025, March 31, 2026 and June 30, 2026, respectively) | 65,781 | 164,744 | 127,650 | 18,813 | 65,781 | 596,798 | 87,957 | |||||||||||||
| Cost of revenues(including related party transaction of nil, RMB1,198 and RMB6,525 for the three months ended June 30, 2025, March 31, 2026 and June 30, 2026, respectively) | (42,970 | ) | (107,884 | ) | (94,671 | ) | (13,953 | ) | (42,970 | ) | (399,547 | ) | (58,886 | ) | ||||||
| Gross Profit | 22,811 | 56,860 | 32,979 | 4,860 | 22,811 | 197,251 | 29,071 | |||||||||||||
| Operating expenses: | ||||||||||||||||||||
| Sales and marketing expenses (including related party transaction of RMB2,472, RMB4,002 and RMB1,421 for the three months ended June 30, 2025, March 31, 2026 and June 30, 2026, respectively) | (19,108 | ) | (57,722 | ) | (56,233 | ) | (8,288 | ) | (19,108 | ) | (194,383 | ) | (28,649 | ) | ||||||
| Research and development expenses | (9,010 | ) | (9,452 | ) | (9,936 | ) | (1,464 | ) | (9,010 | ) | (44,274 | ) | (6,525 | ) | ||||||
| General and administrative expenses | (19,673 | ) | (33,646 | ) | (25,838 | ) | (3,808 | ) | (19,673 | ) | (128,925 | ) | (19,001 | ) | ||||||
| Impairment loss on goodwill | – | – | (124,059 | ) | (18,284 | ) | – | (124,059 | ) | (18,284 | ) | |||||||||
| Total operating expenses | (47,791 | ) | (100,820 | ) | (216,066 | ) | (31,844 | ) | (47,791 | ) | (491,641 | ) | (72,459 | ) | ||||||
| Loss from operations | (24,980 | ) | (43,960 | ) | (183,087 | ) | (26,984 | ) | (24,980 | ) | (294,390 | ) | (43,388 | ) | ||||||
| Other income: | ||||||||||||||||||||
| Interest income | 796 | 3,377 | 3,455 | 509 | 796 | 11,343 | 1,672 | |||||||||||||
| Others, net | 5,728 | 5,725 | (2,366 | ) | (349 | ) | 5,728 | 16,648 | 2,454 | |||||||||||
| Loss before income tax | (18,456 | ) | (34,858 | ) | (181,998 | ) | (26,824 | ) | (18,456 | ) | (266,399 | ) | (39,262 | ) | ||||||
| Income tax (expense)/benefit | (3,350 | ) | 723 | 12,369 | 1,823 | (3,350 | ) | 11,464 | 1,690 | |||||||||||
| Net loss from continuing operations, net of income tax | (21,806 | ) | (34,135 | ) | (169,629 | ) | (25,001 | ) | (21,806 | ) | (254,935 | ) | (37,572 | ) | ||||||
| Net income from discontinued operations, net of income tax | 129,786 | – | – | – | 378,374 | 318,451 | 46,934 | |||||||||||||
| Net income/(loss) | 107,980 | (34,135 | ) | (169,629 | ) | (25,001 | ) | 356,568 | 63,516 | 9,362 | ||||||||||
| Net loss/(income) attributable to non-controlling interests | 2,161 | – | – | – | 2,162 | (1,083 | ) | (160 | ) | |||||||||||
| Net income/(loss) attributable to ordinary shareholders of the Company | 110,141 | (34,135 | ) | (169,629 | ) | (25,001 | ) | 358,730 | 62,433 | 9,202 | ||||||||||
| Including | ||||||||||||||||||||
| Net loss from continuing operations attributable to ordinary shareholders of the Company | (19,641 | ) | (34,135 | ) | (169,629 | ) | (25,001 | ) | (19,641 | ) | (256,006 | ) | (37,730 | ) | ||||||
| Net income from discontinued operations attributable to ordinary shareholders of the Company | 129,782 | – | – | – | 378,371 | 318,439 | 46,932 | |||||||||||||
| Weighted average number of ordinary shares used in computing net (loss)/income per ordinary share | ||||||||||||||||||||
| – Basic | 163,732,982 | 160,407,252 | 158,350,260 | 158,350,260 | 161,291,663 | 161,393,281 | 161,393,281 | |||||||||||||
| – Diluted | 163,732,982 | 160,407,252 | 158,350,260 | 158,350,260 | 161,291,663 | 161,393,281 | 161,393,281 | |||||||||||||
| Net loss from continuing operations per share attributable to ordinary shareholders of the Company– basic | (0.12 | ) | (0.21 | ) | (1.07 | ) | (0.16 | ) | (0.12 | ) | (1.59 | ) | (0.23 | ) | ||||||
| Net income from discontinued operations per share attributable to ordinary shareholders of the Company– basic | 0.79 | – | – | – | 2.35 | 1.97 | 0.29 | |||||||||||||
| Net loss from continuing operations per share attributable to ordinary shareholders of the Company– diluted | (0.12 | ) | (0.21 | ) | (1.07 | ) | (0.16 | ) | (0.12 | ) | (1.59 | ) | (0.23 | ) | ||||||
| Net income from discontinued operations per share attributable to ordinary shareholders of the Company– diluted | 0.79 | – | – | – | 2.35 | 1.97 | 0.29 | |||||||||||||
| Other comprehensive loss | ||||||||||||||||||||
| Foreign currency translation adjustments, net of nil tax | (1,984 | ) | (1,595 | ) | (615 | ) | (91 | ) | (806 | ) | (4,557 | ) | (672 | ) | ||||||
| Total other comprehensive loss | (1,984 | ) | (1,595 | ) | (615 | ) | (91 | ) | (806 | ) | (4,557 | ) | (672 | ) | ||||||
| Total comprehensive income/(loss) | 105,996 | (35,730 | ) | (170,244 | ) | (25,092 | ) | 355,762 | 58,959 | 8,690 | ||||||||||
| Comprehensive loss/(income) attributable to non-controlling interests | 2,161 | – | – | – | 2,162 | (1,083 | ) | (160 | ) | |||||||||||
| Total comprehensive income/(loss) attributable to ordinary shareholders of the Company | 108,157 | (35,730 | ) | (170,244 | ) | (25,092 | ) | 357,924 | 57,876 | 8,530 | ||||||||||
| HERE GROUP LIMITED UNAUDITED RECONCILIATION OF GAAP AND NON-GAAP RESULTS (Amounts in thousands, except for share and per share data) |
||||||||||||||||||||
| The following table sets forth a reconciliation of net loss from continuing operations to adjusted net loss from continuing operations and basic and diluted net loss from continuing operations per ordinary share to basic and diluted adjusted net loss from continuing operations per ordinary share for the periods indicated: |
||||||||||||||||||||
| For the Three Months Ended |
For the Years Ended |
|||||||||||||||||||
| June 30, 2025 |
March 31, 2026 | June 30, 2026 |
June 30, 2026 |
June 30, 2025 |
June 30, 2026 |
June 30, 2026 |
||||||||||||||
| RMB | RMB | RMB | US$ | RMB | RMB | US$ | ||||||||||||||
| Net loss from continuing operations | (21,806 | ) | (34,135 | ) | (169,629 | ) | (25,001 | ) | (21,806 | ) | (254,935 | ) | (37,572 | ) | ||||||
| Less: Share-based compensation expenses | (2,513 | ) | (11,202 | ) | (7,855 | ) | (1,158 | ) | (2,513 | ) | (36,963 | ) | (5,448 | ) | ||||||
| Less: Impairment loss on goodwill | – | – | (124,059 | ) | (18,284 | ) | – | (124,059 | ) | (18,284 | ) | |||||||||
| Adjusted net loss from continuing operations | (19,293 | ) | (22,933 | ) | (37,715 | ) | (5,559 | ) | (19,293 | ) | (93,913 | ) | (13,840 | ) | ||||||
| Attributable to non-controlling interests | 2,165 | – | – | – | 2,165 | (1,071 | ) | (158 | ) | |||||||||||
| Adjusted net loss from continuing operations attributable to the Company | (17,128 | ) | (22,933 | ) | (37,715 | ) | (5,559 | ) | (17,128 | ) | (94,984 | ) | (13,998 | ) | ||||||
| Weighted average number of ordinary shares used in computing net loss from continuing operations per ordinary share | ||||||||||||||||||||
| – Basic | 163,732,982 | 160,407,252 | 158,350,260 | 158,350,260 | 161,291,663 | 161,393,281 | 161,393,281 | |||||||||||||
| – Diluted | 163,732,982 | 160,407,252 | 158,350,260 | 158,350,260 | 161,291,663 | 161,393,281 | 161,393,281 | |||||||||||||
| Weighted average number of ordinary shares used in computing adjusted net loss from continuing operations per ordinary share | ||||||||||||||||||||
| – Basic | 163,732,982 | 160,407,252 | 158,350,260 | 158,350,260 | 161,291,663 | 161,393,281 | 161,393,281 | |||||||||||||
| – Diluted | 163,732,982 | 160,407,252 | 158,350,260 | 158,350,260 | 161,291,663 | 161,393,281 | 161,393,281 | |||||||||||||
| Net loss from continuing operations per ordinary share | ||||||||||||||||||||
| – Basic | (0.12 | ) | (0.21 | ) | (1.07 | ) | (0.16 | ) | (0.12 | ) | (1.59 | ) | (0.23 | ) | ||||||
| – Diluted | (0.12 | ) | (0.21 | ) | (1.07 | ) | (0.16 | ) | (0.12 | ) | (1.59 | ) | (0.23 | ) | ||||||
| Adjusted net loss from continuing operations per ordinary share | ||||||||||||||||||||
| – Basic | (0.10 | ) | (0.14 | ) | (0.24 | ) | (0.04 | ) | (0.11 | ) | (0.59 | ) | (0.09 | ) | ||||||
| – Diluted | (0.10 | ) | (0.14 | ) | (0.24 | ) | (0.04 | ) | (0.11 | ) | (0.59 | ) | (0.09 | ) | ||||||
| HERE GROUP LIMITED UNAUDITED ADDITIONAL INFORMATION (Amounts in thousands, except for shares and per share data) |
|||||||||||||
| The following table sets forth a breakdown of revenue by IPs for the periods indicated: |
|||||||||||||
| For the Three Months Ended |
For the Years Ended |
||||||||||||
| June 30, 2025 |
March 31, 2026 |
June 30, 2026 |
June 30, 2026 |
June 30, 2025 |
June 30, 2026 |
June 30, 2026 |
|||||||
| RMB | RMB | RMB | US$ | RMB | RMB | US$ | |||||||
| Revenues | |||||||||||||
| WAKUKU | 42,959 | 102,404 | 47,746 | 7,037 | 42,959 | 369,291 | 54,427 | ||||||
| SIINONO | – | 33,293 | 27,258 | 4,017 | – | 92,667 | 13,657 | ||||||
| ZIYULI | 17,591 | 14,300 | 12,837 | 1,892 | 17,591 | 57,404 | 8,460 | ||||||
| Others(1) | 5,231 | 14,747 | 39,809 | 5,867 | 5,231 | 77,436 | 11,413 | ||||||
| 65,781 | 164,744 | 127,650 | 18,813 | 65,781 | 596,798 | 87,957 | |||||||
(1) “Others” refers to revenue generated from all other IPs, such as “MEMIMO”, “FUNII”, “FIILA”, “impopo pix” and “YEAOHUA”, and other revenues, aggregated and presented as “Others”.

LEIDEN, Netherlands–(BUSINESS WIRE)–Anavo Therapeutics, a global leader in unlocking the full therapeutic potential of phosphatase biology, today announced the appointment of Vincent G. Brichard, M.D., Ph.D., as Chairman of its Board of Directors. Dr. Brichard brings nearly four decades of experience from across the life sciences including groundbreaking biomedical research, drug development, venture capital investment and corporate strategy and transactions. His appointment marks an importan
LONDON & NEW YORK–(BUSINESS WIRE)–Stonepeak, a leading alternative investment firm specialising in infrastructure and real assets, today announced that it is making an equity investment in AMPYR Distributed Energy (“ADE”), a distributed energy infrastructure platform launched in 2024 with AGP. AGP will retain an interest in ADE. ADE is a leading investor, owner, and operator of distributed energy assets across the UK and Europe. The company funds, builds, owns, and operates onsite renewable e
SINGAPORE–(BUSINESS WIRE)–Barnes Aerospace, a global provider of component engineering, manufacturing and repair solutions for the aerospace industry, today announced that it has signed a memorandum of understanding (MOU) with the Singapore Economic Development Board (EDB) to explore opportunities to expand Barnes Aerospace’s manufacturing, aftermarket component repair and overhaul, engineering, and technology capabilities in Singapore. The MOU builds on Barnes Aerospace’s long-standing prese