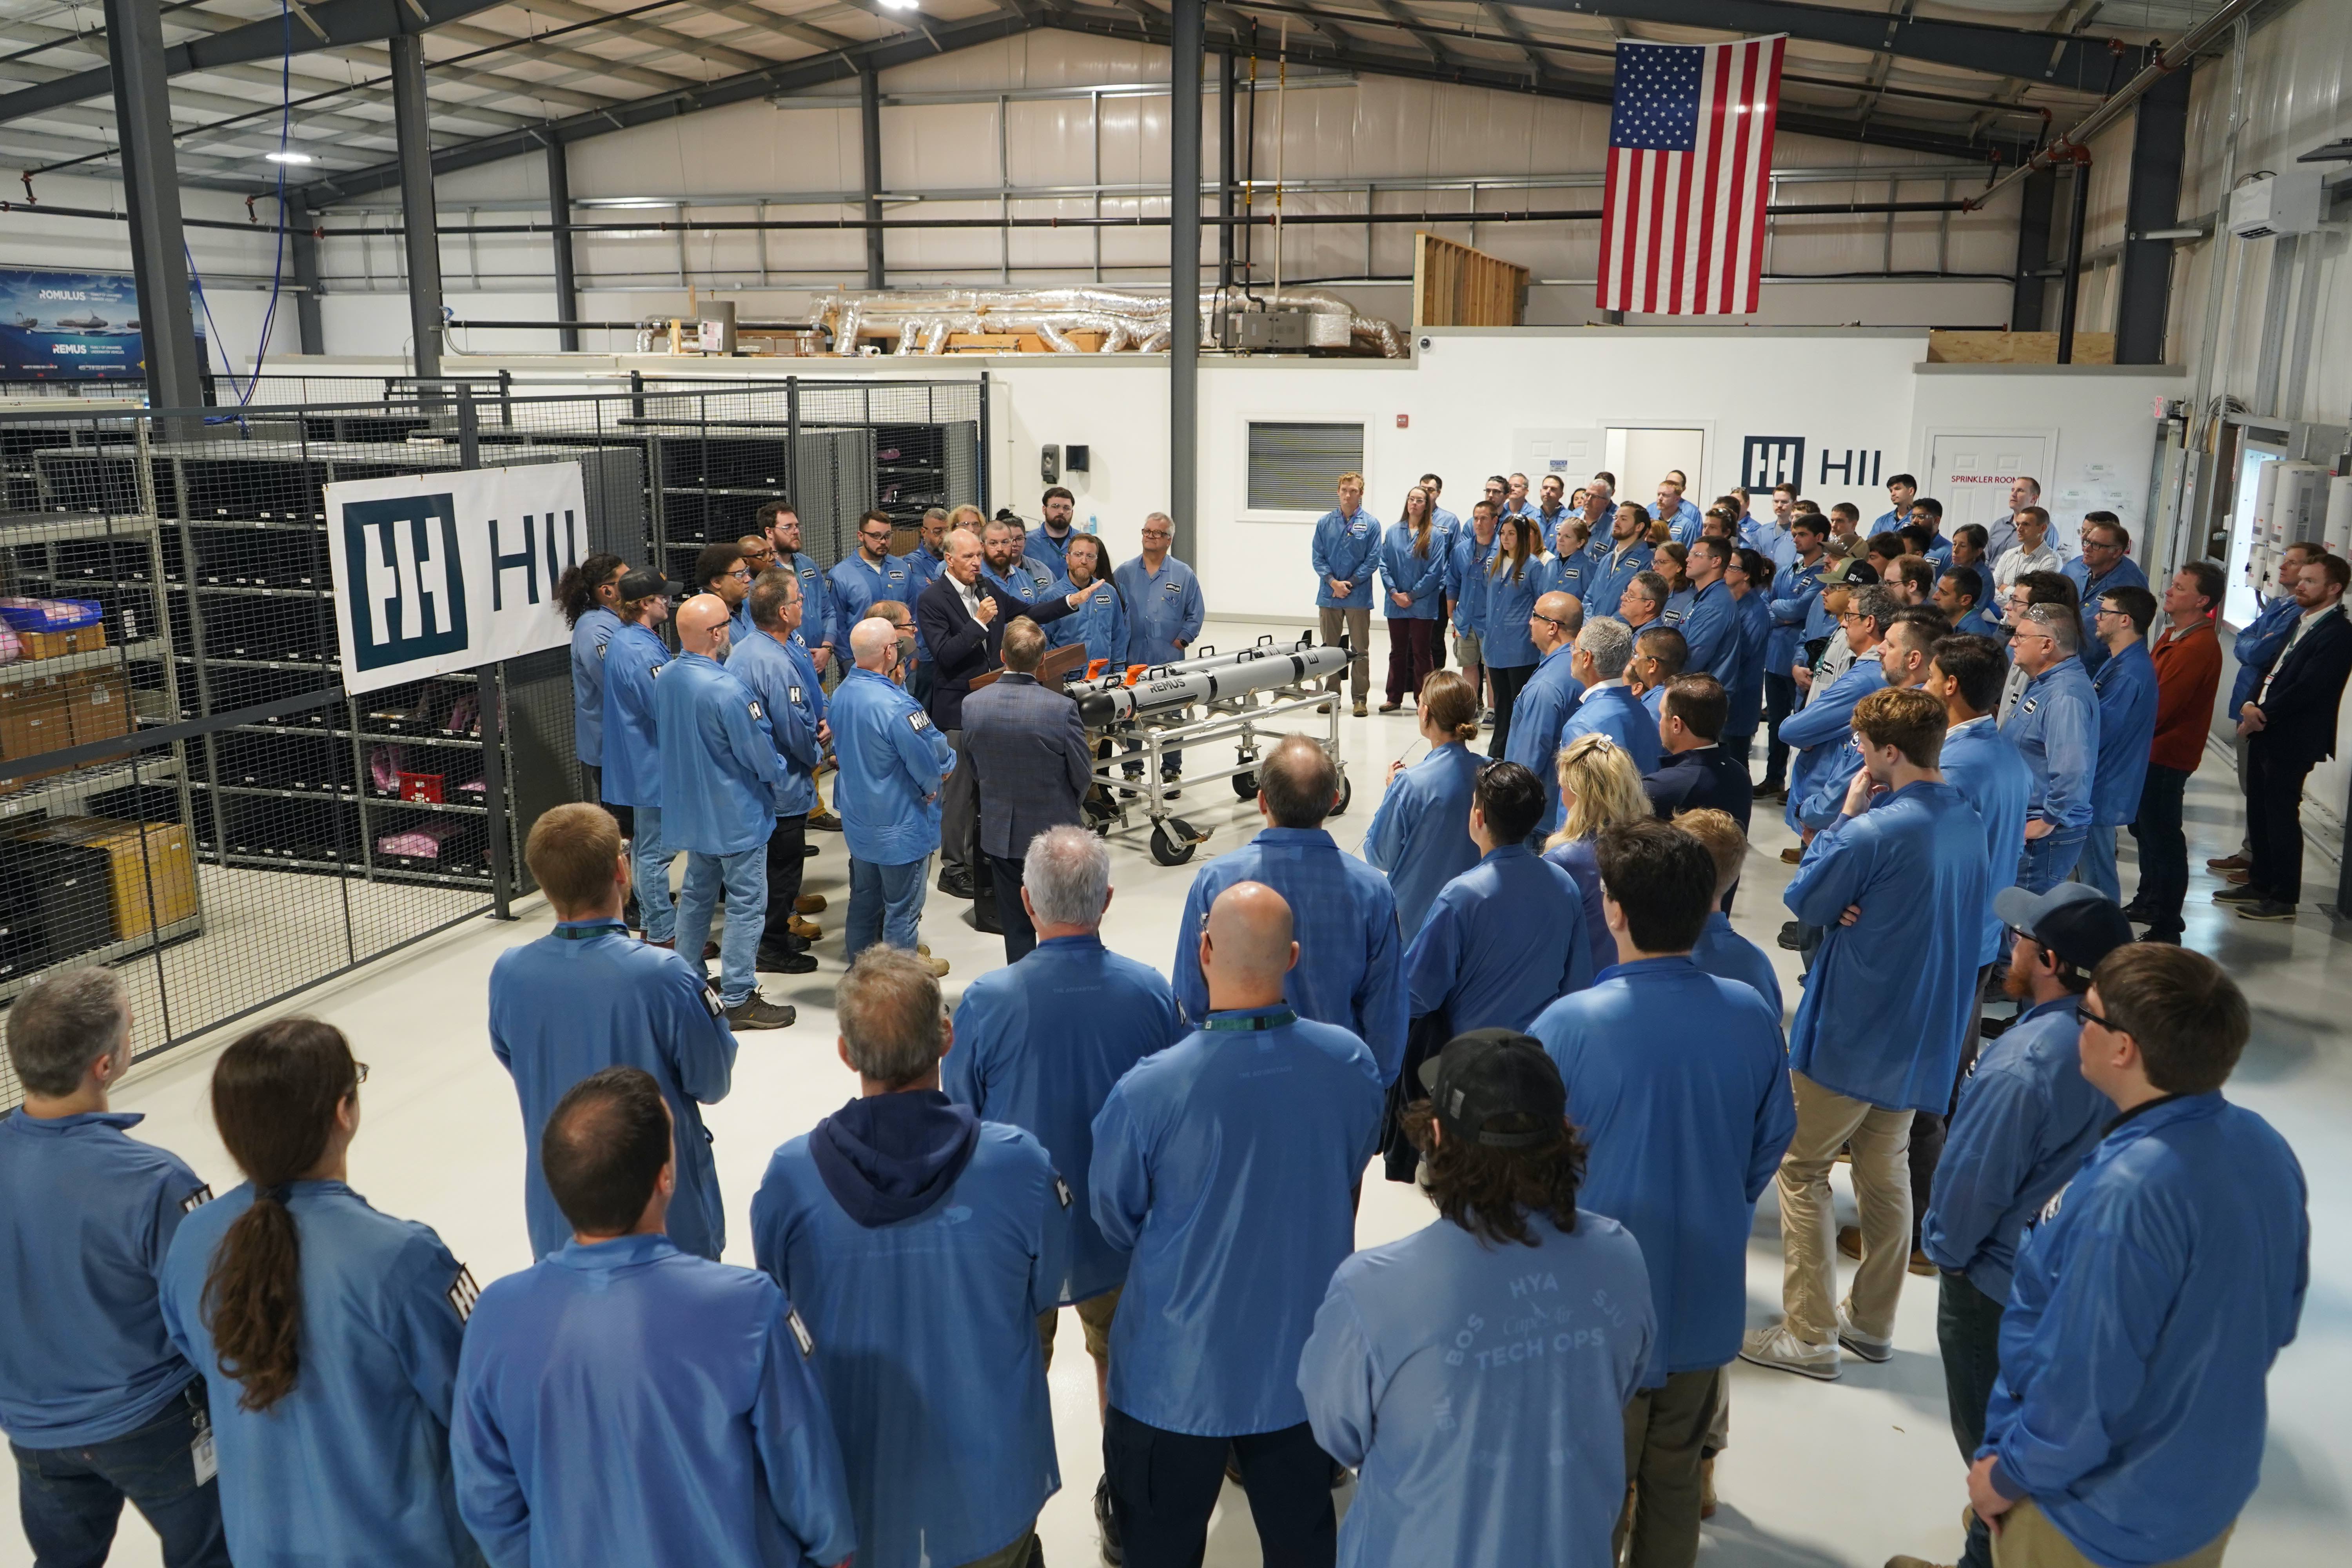
U.S. Rep. Bill Keating joins ribbon-cutting celebrating expanded production capacity, advanced autonomous maritime technology and continued investment in the region

POCASSET, Mass., Sept. 22, 2026 (GLOBE NEWSWIRE) — HII (NYSE: HII), a global leader in autonomous and unmanned maritime systems, celebrated the expansion of its unmanned systems production campus in Pocasset, Massachusetts, underscoring growing global demand for autonomous maritime platforms and the company’s continued investment in advanced unmanned maritime technology, New England’s skilled workforce and the region’s Blue Economy.

The 10,000-square-foot expansion increases the capacity of HII’s existing 40,000-square-foot manufacturing facility capacity to build, develop and integrate advanced unmanned and autonomous maritime systems, including the REMUS family of unmanned underwater vehicles (UUVs) and ROMULUS unmanned surface vessels (USVs).

The expanded facility adds production capacity for the U.S. Navy’s Lionfish small unmanned undersea vehicle (SUUV), which is based on HII’s commercial REMUS 300 platform and is currently in production. In July, the Navy awarded HII an option-year contract for continued Lionfish production. The facility will also support production of HII’s REMUS 620 UUV.

DSC02325

Photos accompanying this release are available at: https://www.hii.com/news/hii-expands-unmanned-production-facility-by-25-to-meet-growing-global-maritime-demand/.

The expansion also advances the integration of HII’s Odyssey Autonomous Control Solutions (ACS) software, which supports advanced maritime autonomous and unmanned operations. These capabilities include simulation and modeling designed to support increasingly complex missions across multiple domains and vehicle types as well as autonomy hardware to be installed on ROMULS USVs.

HII celebrated the expansion with a ribbon-cutting ceremony attended by U.S. Rep. Bill Keating, MA-09, highlighting the company’s growing presence on Cape Cod and the region’s role in maritime technology and advanced manufacturing.

“Today’s expansion reflects HII’s continued investment in the people, technology and partnerships that have made us a leader in unmanned maritime capabilities and placed New England at the center for maritime innovation,” said Duane Fotheringham, president of the Unmanned Systems group in HII’s Mission Technologies division. “By bringing together advanced unmanned platforms, autonomy, integration, simulation and modeling capabilities, we are expanding our ability to deliver the maritime systems our customers need while continuing to create high-quality jobs here in Massachusetts.”

Keating has been a longtime supporter of HII’s operations in Massachusetts and served as a keynote speaker at the 2014 grand opening of HII’s unmanned production facility.

“HII’s continued growth on Cape Cod demonstrates how investments in advanced maritime technology can strengthen our national security while supporting good jobs and economic opportunity here in Massachusetts,” Keating said. “I was proud to join HII for the opening of the Pocasset manufacturing facility, and it is exciting to see how the company’s capabilities and workforce have continued to grow. The technologies being developed here strengthen the Blue Economy, support our maritime communities and help ensure the United States remains at the forefront of ocean innovation.”

HII currently employs approximately 300 people in Pocasset and has added 50 employees year to date in 2026, continuing a pattern of workforce growth in recent years. The expansion reflects the company’s ongoing commitment to Cape Cod and New England as a center for maritime technology development, advanced manufacturing and highly skilled employment.

HII’s unmanned systems heritage on Cape Cod is closely connected to its longstanding technology development partnership with Woods Hole Oceanographic Institution (WHOI). The collaboration has helped advance autonomous underwater technology and reflects the region’s concentration of scientific research, engineering and maritime expertise.

The technologies developed and produced in Pocasset support a broad range of missions. Beyond defense and national security applications, HII’s unmanned and autonomous systems support ocean exploration, academic and scientific research, environmental monitoring and commercial maritime operations.

REMUS UUVs provide autonomous undersea capabilities for missions ranging from oceanographic research and environmental monitoring to defense operations. HII’s ROMULUS USV family extends autonomous capabilities to the surface domain, while Odyssey autonomy provides a foundation for increasingly integrated autonomous operations. Together with HII’s advanced simulation and modeling capabilities, these technologies are designed to help customers plan, test and execute complex maritime autonomous and unmanned missions.

The REMUS family of UUVs, which celebrated its 25th anniversary in 2026, has been field-proven in naval and maritime operations around the world. HII has delivered more than 750 REMUS vehicles to customers in more than 30 countries, including 14 NATO members. More than 90% of REMUS systems delivered over the past 25 years remain in active service today.

The expanded Pocasset facility reinforces HII’s commitment to developing advanced maritime capabilities in Massachusetts while investing in the workforce and communities that support them.

About HII

HII is America’s largest shipbuilder, delivering the world’s most powerful ships and all-domain mission technologies, including unmanned systems, to U.S. and allied defense customers. HII is the largest producer of unmanned underwater vehicles for the U.S. Navy and the world.

With a more than 140-year history of advancing U.S. national security, HII builds and integrates defense capabilities extending from the core fleet to C6ISR, AI/ML, EW and synthetic training. Headquartered in Virginia, HII’s workforce is 45,000 strong. For more information, visit:

Contact:

Greg McCarthy
(202) 264-7126
gregory.j.mccarthy@hii-co.com

A photo accompanying this announcement is available at https://www.globenewswire.com/NewsRoom/AttachmentNg/33bde021-8676-4557-a280-0910a6d53937

KALISPELL, Mont., Sept. 22, 2026 (GLOBE NEWSWIRE) — Glacier Bancorp, Inc.’s (NYSE: GBCI) Board of Directors, at a meeting held on September 22, 2026, declared a quarterly dividend of $0.35 per share. The Company has declared 166 consecutive quarterly dividends and has increased the dividend 50 times. The dividend is payable on October 15, 2026, to owners of record on October 6, 2026.

About Glacier Bancorp, Inc.:
Glacier Bancorp, Inc. is the parent company for Glacier Bank and its bank divisions: Altabank (American Fork, UT), Bank of the San Juans (Durango, CO), Citizens Community Bank (Pocatello, ID), Collegiate Peaks Bank (Buena Vista, CO), First Bank of Montana (Lewistown, MT), First Bank of Wyoming (Powell, WY), First Community Bank Utah (Layton, UT), First Security Bank (Bozeman, MT), First Security Bank of Missoula (Missoula, MT), First State Bank (Wheatland, WY), Glacier Bank (Kalispell, MT), Guaranty Bank & Trust (Mount Pleasant, TX), Heritage Bank of Nevada (Reno, NV), Mountain West Bank (Coeur d’Alene, ID), The Foothills Bank (Yuma, AZ), Valley Bank (Helena, MT), Western Security Bank (Billings, MT), and Wheatland Bank (Spokane, WA).

Visit Glacier’s website at http://www.glacierbancorp.com

Contact: Randall M. Chesler, CEO
(406) 751-4722
Ron J. Copher, CFO
(406) 751-7706

HOUSTON, Sept. 22, 2026 (GLOBE NEWSWIRE) — Kayne Anderson Energy Infrastructure Fund, Inc. (the “Company”) announced today a monthly distribution of $0.095 per share for October 2026. This represents a 5.6% increase over the prior monthly distribution rate (increase of $0.005 per share). This distribution is payable to common stockholders on October 30, 2026, as outlined in the table below.

“We are pleased to announce a 5.6% increase in KYN’s monthly distribution. With this increase, KYN’s distribution has grown by 18.8% over the last 12 months. We believe distribution increases are an important way to return value to our fellow stockholders. KYN’s most recent increase is a reflection of the Company’s strong operating results thus far in fiscal 2026 and an indication of our continued confidence in the long-term fundamentals supporting KYN’s portfolio investments,” stated Jim Baker, KYN’s Chairman, President and Chief Executive Officer.

The Company declares and pays distributions monthly. Payment of future distributions is subject to the approval of the Company’s Board of Directors, as well as meeting the covenants on the Company’s debt agreements and the terms of its preferred stock.

Record Date / Ex-Date Payment Date Distribution Amount Return of Capital
Estimate
10/15/26 10/30/26 $0.095 5%(1)

(1)   This estimate is based on the Company’s anticipated earnings and profits. The final determination of the tax character of distributions will not be determinable until after the end of fiscal 2026 and may differ substantially from this preliminary information.

Kayne Anderson Energy Infrastructure Fund, Inc. (NYSE: KYN) is a non-diversified, closed-end management investment company registered under the Investment Company Act of 1940, as amended, whose common stock trades on the NYSE. The Company’s investment objective is to provide a high after-tax total return with an emphasis on making cash distributions to stockholders. KYN intends to achieve this objective by investing at least 80% of its total assets in securities of Energy Infrastructure Companies. See Glossary of Key Terms in the Company’s most recent quarterly or annual report for a description of these investment categories and the meaning of capitalized terms.

The Company pays cash distributions to common stockholders at a rate that may be adjusted from time to time. Distribution amounts are not guaranteed and may vary depending on a number of factors, including changes in portfolio holdings and market conditions. 

This press release shall not constitute an offer to sell or a solicitation to buy, nor shall there be any sale of any securities in any jurisdiction in which such offer or sale is not permitted. Nothing contained in this press release is intended to recommend any investment policy or investment strategy or consider any investor’s specific objectives or circumstances. Before investing, please consult with your investment, tax, or legal adviser regarding your individual circumstances.

CAUTIONARY NOTE REGARDING FORWARD-LOOKING STATEMENTS: This communication contains statements reflecting assumptions, expectations, projections, intentions, or beliefs about future events. These and other statements not relating strictly to historical or current facts constitute forward-looking statements as defined under the U.S. federal securities laws. Forward-looking statements involve a variety of risks and uncertainties. Risks include, but are not limited to, changes in economic and political conditions; regulatory and legal changes; energy industry risk; leverage risk; valuation risk; interest rate risk; tax risk; and other risks discussed in detail in the Company’s filings with the SEC, available at www.kaynefunds.com or www.sec.gov. Actual results or events could differ materially from these statements or our present expectations or projections. You should not place undue reliance on these forward-looking statements, which speak only as of the date they are made. Kayne Anderson undertakes no obligation to publicly update or revise any forward-looking statements made herein. There is no assurance that the Company’s investment objectives will be attained.

Contact investor relations at 877-657-3863 or cef@kayneanderson.com.

Net Income of $3.4 Million Improving from a Net Loss of $5.5 Million

Adjusted EBITDA increased to $9.4 Million, up 269% YoY

Delivered 1H Revenue of $277 million, a 24% YoY increase

EV Premiums increased 31% YoY to $916 million

NEW YORK, Sept. 22, 2026 (GLOBE NEWSWIRE) — SunCar Technology Group Inc. (the “Company” or “SunCar”) (NASDAQ: SDA), an innovative leader in AI-powered auto insurance and auto services, today announced financial results for the six months ended June 30, 2026.

“SunCar had an excellent first half generating $3.4 million in net income, a substantial $8.9 million improvement from a $5.5 million net loss the first half of 2025,” said Zaichang Ye, Chairman and CEO of SunCar. “Our top-line growth of 24% demonstrated that SunCar can maintain strong revenue growth while also growing profits. Major wins for the Company in the first half including the AgBank chauffeur contract and multiple Huawei ecosystem customer wins show that the size and scope of SunCar’s contracts are increasing.

“I’m particularly pleased with the revenue growth in auto services, which grew 22% from the same period last year. SunCar’s auto services segment is benefiting from our investment in AI and the increased emphasis that our insurance customers are placing on value-added auto services. SunCar is realizing unprecedented synergies from our dual product offering of services and auto insurance. Our partners are achieving a new level of value by integrating SunCar’s AI features into their services. SunCar’s cloud with its combination of insurance and auto services gives our customers a single integrated technology platform from which they can offer a full suite of customized services.

“As always, SunCar’s partners and customers are critical to our growth. Our partnerships with leading companies such as Tesla, Xiaomi, NIO, Xpeng, Huawei, Zeekr, PICC, and Ping An differentiate SunCar and validate the unique product offering we have in the market.

”In terms of technology innovation, SunCar is leading the charge in the next phase of AI which will be vertical industry AI. We have integrated AI into most of our operations and, in cooperation with our partners, are now creating customer-specific AI-powered products. This next phase of AI will be led by companies with deep industry expertise that are leveraging AI to create AI-powered ecosystems just as SunCar is doing for auto insurance and services.”

First Half 2026 Financial Results

  • Total revenue increased 24% to $276.5 million in the first half of 2026 compared to $222.3 million in the prior year period driven by continued consistent growth in auto insurance and strong new growth in auto services.
  • Net income was $3.4 million in the first half of 2026, an improvement of $8.9 million compared to a net loss of $5.5 million in the prior year period reflecting revenue growth in EV insurance and technology services along with disciplined expense management.
  • Adjusted EBITDA was $9.4 million in the first half of 2026, up 276% from $2.5 million in the prior year period reflecting improved operating performance and cost efficiency.
  • EV Premium Growth: Insurance premiums for EVs increased 31% to $915.9 million from US$697.6 million in the prior year period
  • Auto eInsurance service revenue increased 29% to $126.2 million, compared to $97.8 million in the prior year period. The insurance segment maintains its consistent growth with policy renewal revenue as an increasingly significant contributor.
  • Technology Service revenue increased 15% to $28.0 million, up from $24.3 million in the prior year period.
  • Auto Service revenue increased 22% to $122.3 million, compared to $100.1 million for the prior year period. This segment experienced its strongest growth in any period since the Company began reporting.
  • Operating costs and expenses increased 21% to $270.2 million, up from $223.5 million in the prior year period.
  • Integrated service costs increased 39% to $141.3 million, from $101.5 million in the prior year period.
  • Promotional service expenses increased 21% to $114.0 million, from $94.1 million in the prior year period.
  • Selling expenses decreased 49% to $5.6 million, compared to $11.0 million in the prior year period
  • General and administrative expenses decreased 56% to $6.7 million, from $15.2 million in the prior year period
  • Research and development expenses increased 44% to $2.5 million, up from $1.8 million in the prior year period

First Half 2026 Business Highlights

Auto Insurance

  • Tesla: Tesla and SunCar continued to develop innovative insurance products giving drivers the ability to buy insurance online without physically going to a dealer, greatly enhancing the purchasing, renewal, and service experiences.
  • Xiaomi: Xiaomi used SunCar across China for new and renewal policy operations, marketing, and other AI-powered services like inspections.
  • NIO: Nio leveraged SunCar’s app for convenient policy issuance, helping its brands significantly expedite policy issuance and greatly reduce delivery times.
  • Li Auto: Li launched SunCar’s insurance customer service model across China driving more efficient online policy issuance, lead distribution, and renewals.
  • Leapmotor: SunCar’s SaaS solution was implemented in third party and dealer stores. Policy issuance increased 80% online and over 95% in stores YoY.
  • Zeekr: SunCar’s system helped Zeekr stores improve policy issuance efficiency. Customized customer service streamlined new and renewal policy issuance.
  • Huawei: Created a unique service experience with the Qiankun intelligent driving system and HarmonyOS APP; enhancing renewals and service processes.
  • Seres: Seres utilized SunCar’s platform for more efficient settlement operations, providing higher quality service support to both dealers and insurers.
  • GAC Qijing: Won bid for Qijing’s auto insurance business, further extending cooperation with Huawei, combining the intelligence of Qijing’s vehicles and the digital capabilities of Huawei’s Qiankun system.
  • China Post: Expanded China Post’s partner network adding 102 new stores. The total number of partner stores exceeded 300 with continued expansion.

Auto Services

  • PICC: PICC chose SunCar to deliver services such as car wash, parking, maintenance, inspections, and charging vouchers for 7 provincial branches.
  • Ping An Insurance: Ping An selected SunCar for multiple service projects at 9 branches and for airport lounges, and chauffeur services at its headquarters.
  • Ping An Bank: Delivered an innovative combined finance and auto services offering for Ping An Bank; won two-year car wash and chauffeur contracts.
  • CPIC: Success of SunCar’s auto services at 9 CPIC branches led to signing airport concierge VIP lounges service contracts with additional branches.
  • China Continental Insurance: Won new inspection, chauffeur service contracts with new retail branches and added chauffeur services at the headquarters.
  • Agricultural Bank of China: ABC selected SunCar for a major roadside assistance contract and renewed a concierge chauffeur service contract.
  • Bank Customer Chauffeur Deals: SunCar secured additional chauffeur contracts with ICBC, Huaxia Bank, Minsheng, and GRCB banks.
  • China UnionPay: China UnionPay, China’s primary bankcard association, is now using SunCar for carwash services across 14 provinces and major cities.
  • Chauffeur Service Contract Wins: SunCar is expanding its chauffeur business to other sectors by winning non-bank customers such as China Duty Free.

AI Technology Update

SunCar completed AI feature testing for several OEM partners, all with excellent results. The Company completed AI testing for 8 OEM projects with automated testing coverage reaching 75% of vehicles. From an operations perspective, the team’s overall efficiency increased by 45%, with software release quality improving significantly, and error rates reduced by 80%.

Financial Outlook

SunCar continues to forecast its full year 2026 revenue to be approximately $600 million.

About SunCar Technology Group Inc.

Founded in 2007, SunCar is transforming the customer journey for auto insurance and services in China, the largest vehicle market in the world. SunCar develops and operates AI cloud-based platforms that seamlessly connect drivers with a wide range of auto services and insurance coverage options through a nationwide network of sales partners. As a result, SunCar has established itself as the leader in China in the auto eInsurance market for electric vehicles and the B2B auto services market. The Company’s intelligent cloud platform empowers its enterprise customers to access, manage, and optimize their auto eInsurance and auto service offerings. Through SunCar, drivers gain access to a wide variety of high-quality services from tens of thousands of independent providers, all from a single application. For more information, please visit: https://ir.suncartech.com.

Forward-Looking Statements
This press release contains information about the Company’s view of its future expectations, plans, and prospects that constitute forward-looking statements within the meaning of the Private Securities Litigation Reform Act of 1995. Actual results may differ materially from historical results or those indicated by these forward-looking statements as a result of a variety of factors including, but not limited to, risks and uncertainties associated with its ability to raise additional funding, its ability to maintain and grow its business, variability of operating results, its ability to maintain and enhance its brand, its development and introduction of new products and services, the successful integration of acquired companies, technologies and assets into its portfolio of products and services, marketing and other business development initiatives, competition in the industry, general government regulation, economic conditions, dependence on key personnel, the ability to attract, hire and retain personnel who possess the technical skills and experience necessary to meet the requirements of its clients, and its ability to protect its intellectual property. Forward-looking statements in this release include statements regarding the planned launch of AI-powered services, expected improvements in customer experience, potential cost reductions, and the development of SaaS solutions. These statements involve risks, including technology development challenges, market acceptance, regulatory approval requirements, and the ability to scale AI implementations. For a detailed discussion of these risks, please refer to the Company’s Annual Report on Form 20-F and other filings with the Securities and Exchange Commission. Forward-looking statements speak only as of the date of this press release, and the Company undertakes no obligation to update or revise these statements, except as required by law.

Contact Information:

SunCar:

Investor Relations: Mr. Breaux Walker
Email: IR@suncartech.com 

Legal: Ms. Li Chen
Email: chenli@suncartech.com

SOURCE SunCar Technology Group Inc.  

 
SUNCAR TECHNOLOGY GROUP INC
UNAUDITED CONDENSED CONSOLIDATED STATEMENTS OF OPERATIONS AND COMPREHENSIVE (LOSS)/INCOME
(In U.S. Dollar thousands, except for share and per share data, or otherwise noted)
 
    For the six months ended
June 30,
 
    2025     2026  
    (Unaudited)     (Unaudited)  
Revenues            
Auto eInsurance service   $ 97,833     $ 126,159  
Technology service     24,345       28,007  
Auto service     100,131       122,344  
Total revenues     222,309       276,510  
                 
Operating cost and expenses                
Integrated service cost     (101,464 )     (141,312 )
Promotional service expenses     (94,072 )     (114,047 )
Selling expenses     (11,012 )     (5,569 )
General and administrative expenses     (15,188 )     (6,745 )
Research and development expenses     (1,766 )     (2,537 )
Total operating costs and expenses     (223,502 )     (270,210 )
Operating (loss)/income     (1,193 )     6,300  
                 
Other expenses                
Financial expenses, net     (2,077 )     (2,168 )
Investment income     246       221  
Gain on expiration of warrant liabilities     –       18  
Other loss, net     (2,220 )     (51 )
Total other expenses, net     (4,051 )     (1,980 )
                 
(Loss)/income before income tax expense     (5,244 )     4,320  
Income tax expense     (291 )     (943 )
Net (loss)/income     (5,535 )     3,377  
                 
Less: Net income attributable to non-controlling interests     1,859       3,585  
Net loss attributable to the Company’s ordinary shareholders     (7,394 )     (208 )
                 
Net loss attributable to the Company’s ordinary shareholders per ordinary share                
Basic and diluted   $ (0.07 )     –  
                 
Weighted average shares outstanding used in calculating basic and diluted loss per share                
Basic and diluted     102,155,588       102,009,359  
                 
Other comprehensive income                
Foreign currency translation difference     1,048       2,180  
Total other comprehensive income     1,048       2,180  
                 
Total comprehensive (loss)/income     (4,487 )     5,557  
Less: total comprehensive income attributable to non-controlling interest     3,004       5,695  
Total comprehensive loss attributable to the SUNCAR TECHNOLOGY GROUP INC’s shareholders   $ (7,491 )   $ (138 )


SUNCAR TECHNOLOGY GROUP INC
CONDENSED CONSOLIDATED BALANCE SHEETS (UNAUDITED)
(In U.S. Dollar thousands, except for share and per share data, or otherwise noted)
             
    As of
December 31,
    As of
June 30,
 
    2025     2026  
    (Audited)     (Unaudited)  
ASSETS            
Current assets            
Cash   $ 25,019     $ 16,834  
Restricted cash     2,841       3,069  
Short-term investments     21,597       22,122  
Accounts receivable, net     59,767       56,319  
Prepaid expenses and other current assets, net     74,072       99,548  
Total current assets     183,296       197,892  
                 
Non-current assets                
Long-term investment     286       295  
Property, software and equipment, net     24,195       22,787  
Construction in progress     –       27,696  
Intangible asset     408       420  
Deferred tax assets, net     11,947       12,148  
Other non-current assets     30,821       3,344  
Right-of-use assets     2,243       1,889  
Total non-current assets     69,900       68,579  
TOTAL ASSETS   $ 253,196     $ 266,471  
                 
LIABILITIES AND SHAREHOLDERS’ EQUITY                
Current liabilities                
Short-term borrowings   $ 80,394     $ 80,456  
Long-term borrowing, current     71       74  
Accounts payable     41,404       57,187  
Contract liabilities     5,730       3,982  
Tax payable     1,468       1,235  
Accrued expenses and other current liabilities     10,697       3,737  
Amount due to related parties, current     6,659       7,493  
Operating lease liabilities, current     834       848  
Total current liabilities     147,257       155,012  
                 
Non-current liabilities                
Operating lease liabilities, non-current     1,333       989  
Long-term borrowing, non-current     1,358       1,363  
Amount due to related parties, non-current     12,516       12,899  
Warrant liabilities     50       32  
Total non-current liabilities     15,257       15,283  
Total liabilities   $ 162,514     $ 170,295  
                 
Commitments and contingencies (Note 18)                
                 
Shareholders’ equity                
Class A Ordinary shares (par value of $0.0001 per share; 400,000,000 Class A Ordinary shares authorized as of December 31, 2025 and June 30, 2026, respectively; 59,608,351 and 55,969,794 Class A Ordinary shares issued and outstanding as of December 31, 2025 and June 30, 2026, respectively)   $ 6     $ 6  
Class B Ordinary shares (par value of $0.0001 per share; 100,000,000 Class B Ordinary shares authorized as of December 31, 2025 and June 30, 2026, respectively; 46,039,565 and 46,039,565 Class B Ordinary shares issued and outstanding as of December 31, 2025 and June 30, 2026, respectively)     5       5  
Additional paid in capital     233,014       232,989  
Accumulated deficit     (199,329 )     (199,537 )
Accumulated other comprehensive loss     (1,146 )     (1,076 )
Total SUNCAR TECHNOLOGY GROUP INC’s shareholders’ equity     32,550       32,387  
Non-controlling interests     58,132       63,789  
Total shareholders’ equity     90,682       96,176  
TOTAL LIABILITIES AND SHAREHOLDERS’ EQUITY   $ 253,196     $ 266,471  

 
SUNCAR TECHNOLOGY GROUP INC
UNAUDITED CONDENSED CONSOLIDATED STATEMENTS OF CASH FLOWS
(In U.S. Dollar thousands, except for share and per share data, or otherwise noted)
    For the six months ended
June 30,
 
    2025     2026  
    (Unaudited)     (Unaudited)  
CASH FLOWS FROM OPERATING ACTIVITIES:            
Net (loss)/income   $ (5,535 )   $ 3,377  
Adjustments to reconcile net loss to net cash (used in) provided by operating activities:             –  
Provision/(reversal) for credit losses     6,278       (576 )
Depreciation     2,978       3,050  
Amortization of right-of-use assets     430       468  
Share-based compensation of subsidiary     742       –  
Loss on disposal of property, software and equipment     3       1  
Fair value income from short-term investments     –       (6 )
Gain on expiration of warrant liabilities     –       (18 )
Deferred income tax (benefit)/expense     (599 )     163  
Financing expense related to issuance of GEM Warrants     300       229  
Accrued liability for GEM litigation     2,811       –  
Changes in operating assets and liabilities:                
Accounts receivable     (26,603 )     5,796  
Prepaid expenses and other current assets     (6,121 )     (17,829 )
Accounts payable     18,389       14,350  
Contract liabilities     (320 )     (1,903 )
Accrued expenses and other current liabilities     (2,050 )     (5,656 )
Tax payable     519       (275 )
Operating lease liabilities     (369 )     (443 )
Amount due to related parties     (109 )     –  
Total net cash (used in) provided by operating activities     (9,256 )     728  
                 
CASH FLOWS FROM INVESTING ACTIVITIES                
Purchase of property, software and equipment     (23 )     (58 )
Proceeds from disposal of property, software and equipment     1       –  
Proceeds from short term investment     233       357  
Repurchase of non-controlling interests     (2,214 )     (63 )
Purchase of other non-current assets     (5,362 )     (5,669 )
Purchase of short-term investment     (246 )     (216 )
Total net cash used in investing activities     (7,611 )     (5,649 )
                 
CASH FLOWS FROM FINANCING ACTIVITIES                
Proceeds from short-term loan     52,119       51,134  
Repayments of loan     (54,215 )     (53,545 )
Repayments of payables to a related party     (9,798 )     (27 )
Shares repurchase     (15,760 )     –  
Payments for GEM litigation     –       (1,550 )
Proceeds from issuance of ordinary shares, net of issuance cost     41,631       –  
Total net cash provided by (used in) financing activities     13,977       (3,988 )
                 
Effect of exchange rate changes     380       952  
                 
Net change in cash and restricted cash     (2,510 )     (7,957 )
                 
Cash and restricted cash, beginning of the period   $ 29,512     $ 27,860  
Cash and restricted cash, end of the period   $ 27,002     $ 19,903  
                 
Reconciliation of cash and restricted cash to the consolidated balance sheets:                
Cash   $ 24,305     $ 16,834  
Restricted cash   $ 2,697     $ 3,069  
Total cash and restricted cash   $ 27,002     $ 19,903  
                 
Supplemental disclosures of cash flow information:                
Income tax paid   $ 371     $ 1,055  
Interest expense paid   $ 1,757     $ 1,753  
                 
Supplemental disclosures of non-cash flow information:                
Obtaining right-of-use assets in exchange for operating lease liabilities   $ 87     $ 50  
Prepaid financing expense related to issuance of GEM Warrants   $ 534     $ –  

 
SUNCAR TECHNOLOGY GROUP INC
RECONCILIATION OF NET LOSS / INCOME TO ADJUSTED EBITDA
 
    For the six months ended
June 30,
 
    2025     2026  
    (In thousands)  
Net (loss)/income   $ (5,535 )   $ 3,377  
Depreciation     2,978       3,050  
Financial expenses, net     2,077       2,168  
Investment loss     (246 )     (221 )
Other non-recurring income, net     2,220       51  
Income tax expense     291       943  
Share-based compensation (1)     742       –  
Transaction fees (2)     15       –  
Adjusted EBITDA   $ 2,542     $ 9,368  
Net (Loss)/income Margin     -2.5 %     1.2 %
Adjusted EBITDA Margin     1.1 %     3.4 %

SALT LAKE CITY, Sept. 22, 2026 (GLOBE NEWSWIRE) — Medallion Bank (Nasdaq: MBNKO), an FDIC-insured bank providing consumer loans for the purchase of recreational vehicles, boats, and home improvements, along with loan origination services to fintech strategic partners, announced today that it has launched a public offering of additional shares of its Fixed-Rate Reset Non-Cumulative Perpetual Preferred Stock, Series G, par value $1.00 per share, with a liquidation amount of $25 per share (the “Series G Preferred Stock”). The offering is a reopening of Medallion Bank’s original issuance of its Series G Preferred Stock, which occurred on May 22, 2025. Medallion Bank’s Series G Preferred Stock is traded on the Nasdaq Capital Market under the ticker symbol “MBNKO.” Medallion Bank is and will remain a wholly owned subsidiary of Medallion Financial upon completion of the offering.

Medallion Bank expects to grant the underwriters a 30-day option to purchase additional shares of the Series G Preferred Stock solely to cover over-allotments, if any.

Medallion Bank intends to use the net proceeds from this offering for general corporate purposes, which may include, among other things, redeeming some or all of its outstanding Senior Series E Non-Cumulative Perpetual Preferred Stock (the “Series E Preferred Stock”), subject to the prior approval of the Federal Deposit Insurance Corporation.

Piper Sandler & Co., Lucid Capital Markets, LLC, Muriel Siebert & Co., LLC, A.G.P. / Alliance Global Partners, and Ladenburg Thalmann & Co. Inc. are acting as joint book-running managers. William Blair & Company, L.L.C., InspereX LLC, B. Riley Securities, Inc., and Clear Street LLC are acting as lead managers.

The offering of the Medallion Bank’s Series G Preferred Stock is exempt from the registration requirements of the Securities Act of 1933 pursuant to Section 3(a)(2) of that Act and will be made only by means of an offering circular. This press release is for informational purposes only and does not constitute an offer to sell or the solicitation of an offer to buy securities, and shall not constitute an offer, solicitation or sale in any jurisdiction in which such offer, solicitation or sale would be unlawful prior to registration or qualification under the securities laws of that jurisdiction. The securities are neither insured nor approved by the Federal Deposit Insurance Corporation or any other Federal or state regulatory body.

The preliminary offering circular relating to the offering is available at medallionbankoffering.com. In addition, copies of the preliminary offering circular may also be obtained from: Piper Sandler & Co.; Attn: Debt Capital Markets, 1251 Avenue of the Americas, 6th Floor, New York, 10020, or by email at fsg-dcm@psc.com.

About Medallion Bank

Medallion Bank specializes in providing consumer loans for the purchase of recreational vehicles, boats, and home improvements, along with loan origination services to fintech strategic partners. The Bank works directly with thousands of dealers, contractors and financial service providers serving their customers throughout the United States. Medallion Bank is a Utah-chartered, FDIC-insured industrial bank headquartered in Salt Lake City and is a wholly owned subsidiary of Medallion Financial Corp.
For more information, visit www.medallionbank.com

This press release contains “forward-looking statements”, which reflect Medallion Bank’s current views with respect to future events and which address matters that are, by their nature, inherently uncertain and beyond Medallion Bank’s control. These statements are often, but not always, made through the use of words or phrases such as “expect” and “intend” or the negative version of those words or other comparable words or phrases of a future or forward-looking nature. These statements relate to the offering of shares of the Series G Preferred Stock, the anticipated use of the net proceeds by Medallion Bank and the grant to the underwriters of an option to purchase additional shares of the Series G Preferred Stock. No assurance can be given that the transaction discussed above will be completed on the terms described, or at all, or that Medallion Bank will decide to redeem its Series E Preferred Stock or, if it does, the amount to be redeemed and the timing of redemption and required regulatory approval. Completion of the offering on the terms described, including the grant of the option to the underwriters, and the application of net proceeds, are subject to numerous conditions, many of which are beyond the control of Medallion Bank. Medallion Bank undertakes no obligation to publicly update or revise any forward-looking statements, whether as a result of new information, future events or otherwise, except as required by law. For a description of certain risks to which Medallion Bank is or may be subject, please refer to the factors discussed under the headings “Cautionary Note Regarding Forward-Looking Statements” and “Risk Factors,” in Medallion Bank’s Annual Report on Form 10-K for the year ended December 31, 2025 and Quarterly Reports on Form 10-Q for the quarters ended March 31, 2026 and June 30, 2026.

This press release does not constitute a notice of redemption with respect to the Series E Preferred Stock.

Company Contact

Investor Relations

212-328-2176

investorrelations@medallion.com

In accordance with articles L.233-8 II of the French Commercial Code and 223-16 of the General Regulation of the French Financial Markets Authority (Autorité des Marchés Financiers)

PARIS, Sept. 22, 2026 (GLOBE NEWSWIRE) —
Market: Euronext Paris / Nasdaq
Euronext Compartment: B
ISIN code: FR0011341205
Nasdaq: NBTX
Bloomberg: NANO:FP
Reuters: NANO.PA
Website: www.nanobiotix.com

Date
Number of Shares
Outstanding
Total number of voting rights
Total voting rights,
theoretical1
Total voting rights,
exercisable2
August 31, 2026 50,941,528 54,701,246 54,679,128
       

About NANOBIOTIX

Nanobiotix is a late-stage clinical biotechnology company pioneering disruptive, physics-based therapeutic approaches to revolutionize treatment outcomes for millions of patients; supported by people committed to making a difference for humanity. The Company’s philosophy is rooted in the concept of pushing past the boundaries of what is known to expand possibilities for human life.

Incorporated in 2003, Nanobiotix is headquartered in Paris, France and is listed on Euronext Paris since 2012 and on the Nasdaq Global Select Market in New York City since December 2020. The Company has a subsidiary in Cambridge, Massachusetts (United States).

Nanobiotix is the owner of more than 30 patent families associated with three (3) nanotechnology platforms with applications in 1) oncology; 2) bioavailability and biodistribution; and 3) disorders of the central nervous system.

For more information about Nanobiotix, visit us at www.nanobiotix.com or follow us on LinkedIn and Twitter.

_________________________________

1 The total number of theoretical (or “gross”) voting rights is used as the basis for calculating threshold crossings. In accordance with Article 223-11 of the AMF General Regulations, this number is calculated on the basis of all shares to which voting rights are attached, including those for which voting rights have been suspended.

2 The total number of exercisable at a shareholders’ meeting (or “net”) voting rights is calculated without taking into account shares for which voting rights have been suspended as shares held in treasury by the Company. It is released in order to ensure that the public is properly informed.

Contacts

Nanobiotix
Communications Department
Brandon Owens
VP, Communications
+1 (617) 852-4835
contact@nanobiotix.com
Investor Relations Department
Joanne Choi
VP, Investor Relations (US)
+1 (713) 609-3150

Ricky Bhajun
Director, Investor Relations (EU)

investors@nanobiotix.com

Media Relations
France – HARDY
Caroline Hardy
+33 06 70 33 49 50
carolinehardy@outlook.fr
Global – uncapped
Becky Lauer
+1 (646) 286-0057
uncappednanobiotix@uncappedcommunications.com
   

Attachment

KINGSTON, N.Y., Sept. 22, 2026 (GLOBE NEWSWIRE) — Kingstone Companies, Inc. (Nasdaq: KINS) (“Kingstone” or the “Company”), a regional property and casualty insurance holding company, today announced that management will participate in the following investor events.

Sidoti Small-Cap Virtual Conference
Meryl Golden, President and Chief Executive Officer, and Randy Patten, Vice President and Chief Financial Officer, will participate in the Sidoti Small-Cap Virtual Conference on Wednesday, September 23, 2026. Management is scheduled to present at 9:15 a.m. Eastern Time and host virtual one-on-one meetings with investors. A live webcast and replay of the presentation will be available at https://sidoti.zoom.us/webinar/register/WN_m8_b6lgiRjukKtUE2zTNPQ.

Oppenheimer Insurance Summit
Management will participate in the virtual Oppenheimer Insurance Summit on Thursday, September 24, 2026, and host one-on-one meetings with investors.

FoolFest 2026
Meryl Golden will participate in a virtual interview at FoolFest 2026 on Friday, October 9, 2026, at 4:00 p.m. Eastern Time. Tom Gardner, Co-Founder and Chief Executive Officer of The Motley Fool, will host the interview.

Investors interested in scheduling a meeting with Kingstone management are encouraged to contact their respective conference representative or the Company’s investor relations team at KINS@elevate-ir.com.

About Kingstone Companies, Inc.
Kingstone is a regional property and casualty insurance holding company whose principal operating subsidiaries write business through retail and wholesale agents and brokers. Kingstone delivers tailored homeowners insurance solutions through its sophisticated product suite, Select, supported by a scalable and efficient operating platform that enables the Company to pursue significant market opportunities and strategic expansion. Kingstone was the 11th largest writer of homeowners insurance in New York in 2025 and also writes homeowners coverage in California on a non-admitted basis.

Investor Relations Contact
Elevate IR
KINS@elevate-ir.com
720-330-2829

NEW YORK, Sept. 22, 2026 (GLOBE NEWSWIRE) — Interparfums, Inc. (NASDAQ GS: IPAR) (“Interparfums” or the “Company”) today announced that it has entered into an exclusive, worldwide license agreement with sports company PUMA for the creation, development, production, and distribution of fragrances under the PUMA brand name.   

Interparfums plans to introduce this new signature lifestyle fragrance in 2027 under a license agreement that runs through December 31, 2037.

“PUMA is an iconic global brand that connects world-class athletic performance with culture, fashion, and everyday lifestyle,” said Jean Madar, Chairman and Chief Executive Officer of Interparfums. “Through its innovative products, deep relationships with elite athletes and teams, and disruptive collaborations across design and popular culture, PUMA has built relevance well beyond the field of play and established a formidable presence in key markets around the world. We look forward to translating this cultural significance into a new fragrance that extends the PUMA brand and engages consumers across markets, generations, and style preferences.”

“We are delighted for PUMA to join the Interparfums brand portfolio,” said Nina Jacobsen Director Licensed Business at PUMA. “Interparfums has built an exceptional reputation for translating the essence of iconic brands into distinctive fragrance experiences, supported by a proven record of execution, global reach, and deep understanding of consumers. Together, we expect to leverage PUMA’s cultural relevance, energy and global brand appeal to create a fragrance that will be embraced by consumers around the world.”

About PUMA
PUMA is one of the world’s leading sports brands, designing, developing, and selling footwear, apparel and accessories. Founded in 1948, PUMA helps the world’s best athletes and teams perform at their best with its innovative products. Known for its iconic cat logo and the Formstrip, the company offers performance products in categories such as Football, Running and Training. Its Sportstyle collections are rooted in sports and inspire consumers by celebrating sports culture. With its long history and strong heritage, PUMA is proud of having one of the strongest archives in the industry, with many iconic products such as the Suede and the Speedcat. The PUMA Group owns the brands PUMA, Cobra Golf and stichd. The company distributes its products in over 120 countries, employs around 20,000 people and is headquartered in Herzogenaurach/Germany.

About Interparfums, Inc.:
Operating in the global fragrance business since 1982, Interparfums, Inc. produces and distributes a wide array of prestige fragrance and fragrance related products under license and other agreements with brand owners. The Company manages its business in two operating segments, European based operations, through its 72% owned subsidiary, Interparfums SA, and United States based operations, through wholly owned subsidiaries in the United States and Italy.

Our licensed portfolio of prestige brands includes Abercrombie & Fitch, Anna Sui, Boucheron, Coach, Donna Karan/DKNY, Emanuel Ungaro, Ferragamo, Graff, GUESS, Hollister, Jimmy Choo, Karl Lagerfeld, Kate Spade, Lacoste, Longchamp, MCM, Moncler, Montblanc, Oscar de la Renta, Puma, Roberto Cavalli, and Van Cleef & Arpels, whose products are distributed in over 120 countries around the world through an extensive and diverse network of distributors. Interparfums, Inc. is also the registered owner of several trademarks including Annick Goutal, Lanvin, Off-White, Rochas, and Solférino.

Forward-Looking Statements:
Statements in this release which are not historical in nature are forward-looking statements. Although we believe that our plans, intentions, and expectations reflected in such forward-looking statements are reasonable, we can give no assurance that such plans, intentions, or expectations will be achieved. In some cases, you can identify forward-looking statements by forward-looking words such as “anticipate,” “believe”, “could”, “estimate”, “expect”, “intend”, “may”, “should”, “will”, and “would” or similar words. You should not rely on forward-looking statements, because actual events or results may differ materially from those indicated by these forward-looking statements as a result of a number of important factors. These factors include, but are not limited to, the risks and uncertainties discussed under the headings “Forward Looking Statements” and “Risk Factors” in Interparfums’ annual report on Form 10-K for the fiscal year ended December 31, 2025, and the reports Interparfums files from time to time with the Securities and Exchange Commission. Interparfums does not intend to and undertakes no duty to update the information contained in this press release.

Contact Information:

Interparfums, Inc.
Michel Atwood
Chief Financial Officer
(212) 983-2640
www.interparfumsinc.com
or The Equity Group Inc. 
Devin Sullivan: (212) 836-9608 / devin.sullivan@theequitygroup.com
Conor Rodriguez: (212) 836-9628 / conor.rodriguez@theequitygroup.com
www.theequitygroup.com
     

– Provides Investment and Capital Markets Update –

NEW YORK, Sept. 22, 2026 (GLOBE NEWSWIRE) — Getty Realty Corp. (NYSE: GTY) (“Getty” or the “Company”), a net lease REIT focused on convenience and automotive retail real estate, announced today that it has closed a $260.9 million sale leaseback transaction with Refuel Operating Company, LLC (“Refuel”), a leading convenience store and retail fuel owner and operator with approximately 250 locations in five states across the Southeastern United States. Pursuant to the transaction, the Company acquired 41 convenience stores and simultaneously entered into four long-term, unitary net leases with Refuel (the “Refuel Transaction”).

The acquired properties are diversified across several growing markets and include 17 stores in South Carolina, 12 stores in North Carolina, seven stores in Texas, and five stores in Mississippi. The properties in each state are subject to unitary leases with initial terms of 20 years, multiple renewal options, and rent increases every five years. The 41 convenience stores are modern, large-format locations that include proprietary hot food offerings and/or branded QSRs, and average nearly 5,000 square feet and 2.5 acres per site.

Refuel is an existing tenant at six convenience stores owned by the Company, five of which were new-to-industry construction financed through Getty’s development funding program. Pro forma for the Refuel Transaction and other investment activity closed subsequent to June 30, 2026, Refuel will be the Company’s third largest tenant, representing approximately 7.7% of the Company’s annualized base rent.

Getty expects to fund the Refuel Transaction on a leverage-neutral basis through a combination of proceeds from unsettled forward equity sale agreements, a new unsecured term loan, and identified property dispositions. See Investment and Capital Markets Update below for additional information.

“We are excited to partner with Refuel on its first portfolio sale leaseback transaction and to further advance the relationship we have cultivated over the last several years,” stated Christopher J. Constant, Getty’s President & Chief Executive Officer. “Refuel is one of the leading operators in the convenience store sector, and its premium brand, growing platform, and high-quality real estate align well with Getty’s underwriting criteria for convenience store acquisitions.”

“Getty has been a trusted partner to Refuel for several years, and we are thrilled to expand our relationship through this strategic transaction,” said Travis Smith and Jon Rier, Co-CEOs of Refuel. “This transaction creates a more balanced mix of owned and leased real estate, improves the efficiency of our capital structure, and provides additional flexibility to continue investing in our stores, our people, and the long-term growth of Refuel.”

About Refuel

Founded in 2008, Refuel is a leading retail and convenience platform operating approximately 250 locations under the Refuel and Double Quick brands across South Carolina, North Carolina, Texas, Mississippi, and Arkansas. Refuel is a portfolio company of First Reserve, a leading private equity firm investing across Infrastructure Solutions, Value-Added Infrastructure, and Resources strategies with exposure in energy, utility, and industrial markets. First Reserve acquired Refuel in 2019 and has supported its growth from five stores in Charleston, South Carolina, to its current regional footprint.

Investment and Capital Markets Update

Investment Activity and Pipeline

Year to date, the Company has invested approximately $455.2 million in convenience and automotive retail assets at a 7.1% initial cash yield, including the Refuel Transaction and approximately $35.7 million of additional investment activity subsequent to June 30, 2026.

The Company currently has a committed investment pipeline of more than $125.0 million for the development and/or acquisition of additional convenience and automotive retail properties at initial cash yields averaging 7.8%.

Equity Capital Markets

Subsequent to June 30, 2026, the Company entered into new forward sale agreements to sell approximately 0.8 million shares of common stock for anticipated gross proceeds of approximately $26.4 million.

The Company currently has a total of approximately 6.6 million shares of common stock subject to outstanding forward sale agreements, which are anticipated to raise gross proceeds of approximately $216.9 million upon settlement. The Company anticipates using approximately $100.0 million of the proceeds to fund a portion of the Refuel Transaction.

Debt Capital Markets

The Company has received commitments from a group of existing lenders for a new $200.0 million unsecured term loan and anticipates using approximately $100.0 million of the proceeds to fund a portion of the Refuel Transaction.

The new term loan is expected to close in October 2026 and mature in October 2028, with three one-year extension options exercisable at the Company’s option, subject to certain standard conditions.

Dispositions

The Company has identified select properties for disposition that are expected to generate at least $50.0 million of gross proceeds, which can be accretively redeployed to fund a portion of the Refuel Transaction. Year to date, the Company has sold 13 properties for gross proceeds of $19.1 million, representing a 5.7% cap rate on stabilized assets, and has additional properties in various stages of the disposition process.

About Getty Realty Corp.

Getty Realty Corp. is a publicly traded, net lease REIT specializing in the acquisition, financing and development of convenience, automotive and other single tenant retail real estate. As of September 22, 2026, the Company’s portfolio included 1,269 freestanding properties located in 46 states across the United States and Washington, D.C.

Forward-Looking Statements

Certain statements contained herein may constitute “forward-looking statements” within the meaning of the Private Securities Litigation Reform Act of 1995. When the words “believes,” “expects,” “plans,” “projects,” “estimates,” “anticipates,” “predicts,” “outlook” and similar expressions are used, they identify forward-looking statements. These forward-looking statements are based on management’s current beliefs and assumptions and information currently available to management and involve known and unknown risks, uncertainties and other factors which may cause the actual results, performance or achievements of the Company to be materially different from any future results, performance or achievements expressed or implied by these forward-looking statements.

Information concerning factors that could cause the Company’s actual results to differ materially from these forward-looking statements can be found elsewhere in this press release, including, without limitation, those statements in the Company’s periodic reports filed with the Securities and Exchange Commission. The Company undertakes no obligation to publicly release revisions to these forward-looking statements to reflect future events or circumstances or to reflect the occurrence of unanticipated events.

Contacts:   Brian Dickman   Investor Relations
    Chief Financial Officer   (646) 349-0598
    (646) 349-6000   ir@gettyrealty.com

COLUMBUS, Ohio, Sept. 22, 2026 (GLOBE NEWSWIRE) — Worthington Enterprises Inc. (NYSE: WOR), a designer and manufacturer of market-leading products and solutions for building, trade and specialty applications, today reported results for its fiscal 2027 first quarter ended August 31, 2026.

Recent Developments and First Quarter Highlights (all comparisons to the first quarter of fiscal 2026)

  • Net sales were $343.9 million, an increase of $40.2 million, or 13%, including 6% from recent acquisitions and 7% from organic growth.
  • Net earnings increased 22% to $42.6 million, while adjusted net earnings increased 3% to $40.1 million and adjusted EBITDA grew 10% to $74.0 million.
  • Earnings per share on a fully diluted basis (“EPS – diluted”) improved to $0.87 from $0.70 per share, while adjusted EPS – diluted increased to $0.82 per share compared to $0.78.
  • Operating cash flow increased $25.7 million to $66.7 million, while free cash flow increased $26.1 million to $54.0 million.
  • Repurchased 335,000 common shares for $18.2 million, leaving 4,230,000 common shares available under the existing repurchase authorization.
  • Declared a quarterly dividend of $0.20 per share payable on December 29, 2026, to shareholders of record at the close of business on December 15, 2026.
  • Renamed two business segments to better reflect their markets and applications: Building Products is now Building Performance Solutions, and Consumer Products is now Trade & Specialty Solutions.

“We started fiscal 2027 with solid performance as our teams continued to execute well and deliver for our customers,” said Worthington Enterprises President and CEO Joe Hayek. “We generated 7% organic growth, grew adjusted EBITDA by 10% and nearly doubled free cash flow. These results reflect the progress we are making as we continue to optimize and grow Worthington Enterprises.”

Financial highlights for the current year and prior year quarters are as follows:

(U.S. dollars in millions, except per share amounts) 1Q 2027     1Q 2026  
GAAP Financial Measures          
Net sales $ 343.9     $ 303.7  
Operating income   13.0       9.2  
Earnings before income taxes   55.6       45.7  
Net earnings   42.6       34.8  
EPS – diluted   0.87       0.70  
Net cash provided by operating activities   66.7       41.1  
           
Non-GAAP Financial Measures (1)          
Adjusted operating income $ 13.7     $ 13.9  
Adjusted EBITDA   74.0       67.2  
Adjusted net earnings   40.1       38.9  
Adjusted EPS – diluted   0.82       0.78  
Free cash flow   54.0       27.9  

(1) Refer to the “GAAP / Non-GAAP Reconciliations” and the “Use of Non-GAAP Financial Measures and Definitions” sections of this release for additional information regarding the use of non-GAAP financial measures and reconciliations to the most directly comparable financial measures calculated and presented in accordance with GAAP.

Consolidated Quarterly Results 

Net sales for the first quarter of fiscal 2027 increased $40.2 million, or 13.2%, over the prior year quarter to $343.9 million. Recent acquisitions contributed $19.2 million to net sales in the current year quarter. Excluding the impact of acquisitions, net sales increased $21.0 million, or 6.9%, compared to the prior year quarter.

Operating income increased $3.8 million to $13.0 million. Adjusted operating income was relatively flat at $13.7 million compared to $13.9 million in the prior year quarter. The current year quarter benefited from $4.0 million in net tariff refunds related to the International Emergency Economic Powers Act (“IEEPA”), contributions from recent acquisitions and higher overall volume within Trade & Specialty Solutions. These benefits were offset by lower overall volume and unfavorable product mix within Building Performance Solutions.

Equity in net income of unconsolidated affiliates increased $3.9 million from the prior year quarter to $40.6 million, driven by higher contributions from WAVE and ClarkDietrich, which were up $2.7 million and $1.4 million, respectively.

Miscellaneous income, net was favorable by $4.2 million, primarily due to a pre-tax gain of $4.0 million related to an earnout agreement associated with the sale of the company’s former oil and gas products business, which was divested in January 2021.

Income tax expense was $13.0 million in the first quarter of fiscal 2027 compared to $10.9 million in the prior year quarter. The increase was driven by higher pre-tax earnings. Income tax expense in the first quarter of fiscal 2027 reflects an estimated annual effective tax rate of 24.1%, compared to 23.8% in the prior year quarter.

Balance Sheet and Cash Flow

Total debt of $305.6 million at quarter end consisted entirely of long-term debt and was relatively unchanged from May 31, 2026. During the quarter, the company amended its revolving credit facility to extend the maturity date to August 31, 2031. The company had no borrowings under its revolving credit facility as of August 31, 2026, leaving $500.0 million available for future use and providing substantial liquidity.

The company ended the quarter with cash of $55.1 million, an increase of $27.3 million over May 31, 2026, primarily driven by strong operating cash flow. During the first quarter of fiscal 2027, the company generated operating cash flow of $66.7 million, of which $12.8 million was invested in capital expenditures, resulting in free cash flow of $54.0 million, up from $27.9 million in the prior year quarter.

Quarterly Segment Results

On September 15, 2026, the company announced new names for its two business segments that better reflect the markets they serve, the value they provide to customers and the evolution of the company’s product portfolio. The Building Products segment is now Building Performance Solutions and the Consumer Products segment is now Trade & Specialty Solutions. The changes are to the segment names only and do not affect the composition of the segments or the company’s historical financial results.

Building Performance Solutions generated net sales of $215.1 million in the current year quarter, an increase of $30.3 million, or 16.4%, over the prior year quarter. The increase was driven by the impact of acquisitions, which contributed $19.2 million to net sales in the current year quarter. Excluding the impact of acquisitions, net sales increased $11.1 million, or 6.0%, compared to the prior year quarter. Adjusted EBITDA was relatively flat at $59.8 million, as higher contributions from WAVE and ClarkDietrich and earnings from recent acquisitions were offset by lower overall volume and unfavorable product mix.

Trade & Specialty Solutions generated net sales of $128.8 million in the current year quarter, up $9.9 million, or 8.3%, from the prior year quarter, driven by higher volume and higher average selling prices. Adjusted EBITDA increased $7.9 million to $24.0 million, driven by the impact of higher net sales and the net benefit of IEEPA tariff refunds.

Outlook

“We’re very encouraged by our start to fiscal 2027 and the opportunities we see across our businesses, including rapidly growing demand for our engineered ASME tanks used in liquid cooling systems for data centers,” Hayek said. “Our teams remain focused on innovation, operational improvement and developing new ways to create value for our customers. With growing free cash flow generation and a healthy balance sheet, we have the flexibility to invest in and pursue additional growth opportunities that fit our strategy.”

Conference Call

The company will review fiscal 2027 first quarter results during its quarterly conference call on September 23, 2026, at 8:30 a.m. Eastern Time. Details regarding the conference call can be found on the company website at www.WorthingtonEnterprises.com.

Upcoming Investor and Analyst Day – November 10, 2026

Worthington Enterprises will host an Investor and Analyst Day on November 10 in New York City where members of the company’s leadership team will provide an in-depth review of the company’s strategy, financial performance and long-term growth opportunities, including perspectives on Building Performance Solutions and Trade & Specialty Solutions.

The event will begin at 9:30 a.m. Eastern Time. Joe Hayek, president and chief executive officer; Colin Souza, vice president and chief financial officer; Jimmy Bowes, president, Building Performance Solutions; and Steve Caravati, president, Trade & Specialty Solutions, are scheduled to deliver presentations.

Investors and analysts interested in participating virtually may register at this link: https://worthington-enterprises-investor-day-2026-11-10.open-exchange.net. In-person attendance is limited. Investors and analysts interested in attending in person should contact Marcus Rogier at marcus.rogier@wthg.com.

About Worthington Enterprises

Worthington Enterprises Inc. (NYSE: WOR) is a designer and manufacturer of market-leading brands that improve everyday life by elevating spaces and experiences. Building Performance Solutions (formerly Building Products) delivers essential engineered products that enhance performance across residential and commercial buildings, including critical facilities such as data centers. Its products support building systems, and climate and comfort applications. The segment primarily serves OEMs and distributors. Trade & Specialty Solutions (formerly Consumer Products) includes market-leading brands used by professional tradespeople and consumers across tools, portable propane and helium and other specialty applications. The Worthington Enterprises portfolio includes Balloon Time®, Bernzomatic®, ClarkDietrich, Coleman® propane cylinders, Elgen, General®, HALO™, LEVEL5 Tools®, Ragasco®, Roof Hugger®, Well-X-Trol® and Worthington Armstrong Venture (WAVE), among others.

Headquartered in Columbus, Ohio, Worthington Enterprises employs approximately 4,000 people throughout North America and Europe.

Founded in 1955 as Worthington Industries, Worthington Enterprises follows a people-first Philosophy with earning money for its shareholders as its first corporate goal. Worthington Enterprises achieves this outcome by empowering its employees to innovate, thrive and grow with leading brands in attractive markets that improve everyday life. The company engages deeply with local communities where it has operations through volunteer efforts and The Worthington Companies Foundation, participates actively in workforce development programs and reports annually on its corporate citizenship and sustainability efforts. For more information, visit worthingtonenterprises.com.

Safe Harbor Statement

Selected statements contained in this release constitute “forward-looking statements,” as that term is used in the Private Securities Litigation Reform Act of 1995 (the “Act”). We wish to take advantage of the safe harbor provisions included in the Act. Forward-looking statements reflect our current expectations, estimates or projections concerning future results or events. These statements are often identified by the use of forward-looking words or phrases such as “believe,” “expect,” “anticipate,” “may,” “could,” “should,” “would,” “intend,” “plan,” “will,” “likely,” “estimate,” “project,” “position,” “strategy,” “target,” “aim,” “seek,” “foresee” and similar words or phrases. These forward-looking statements include, without limitation, statements relating to: future or expected cash positions, liquidity and ability to access financial markets and capital; outlook, strategy or business plans; future or expected growth, growth potential, forward momentum, performance, competitive position, sales, volumes, cash flows, earnings, margins, balance sheet strengths, debt, financial condition or other financial measures; pricing trends for raw materials and finished goods and the impact of pricing changes; the ability to improve or maintain margins; expected demand or demand trends; additions to product lines and opportunities to participate in new markets; expected benefits from transformation and innovation efforts; the ability to improve performance and competitive position; anticipated working capital needs, capital expenditures and asset sales; anticipated improvements and efficiencies in costs, operations, sales, inventory management, sourcing and the supply chain and the results thereof; projected profitability potential; the ability to make acquisitions and the projected timing, results, benefits, costs, charges and expenditures related to acquisitions, joint ventures, headcount reductions and facility dispositions, shutdowns and consolidations; projected capacity and the alignment of operations with demand; the ability to operate profitably and generate cash in down markets; the ability to capture and maintain market share and to develop or take advantage of future opportunities, customer initiatives, new businesses, new products and new markets; expectations for inventories, jobs and orders; expectations for the economy and markets or improvements therein; expectations for generating improving and sustainable earnings, earnings potential, margins or shareholder value; effects of judicial rulings; effects of pandemics and widespread health crises and the various responses of governmental and nongovernmental authorities thereto on economies and markets, and on our customers, counterparties, employees and third-party service providers; and other non-historical matters.

Because they are based on beliefs, estimates and assumptions, forward-looking statements are inherently subject to risks and uncertainties that could cause actual results to differ materially from those projected. Any number of factors could affect actual results, including, without limitation, those that follow: the effect of conditions in national and worldwide financial markets, including inflation, increases in interest rates and economic recession, and with respect to the ability of financial institutions to provide capital; the impact of tariffs, the adoption of trade restrictions affecting our products or suppliers, a United States withdrawal from or significant renegotiation of trade agreements, the occurrence of trade wars, the closing of border crossings, and other changes in trade regulations or relationships; changing oil prices and/or supply; product demand and pricing; changes in product mix, product substitution and market acceptance of our products; volatility or fluctuations in the pricing, quality or availability of raw materials (particularly steel), supplies, transportation, utilities, labor and other items required by operations; effects of sourcing and supply chain constraints; the outcome of adverse claims experience with respect to workers’ compensation, product recalls or product liability, casualty events or other matters; effects of facility closures and the consolidation of operations; the effect of financial difficulties, consolidation and other changes within the steel, automotive, construction and other industries in which we participate; failure to maintain appropriate levels of inventories; financial difficulties (including bankruptcy filings) of original equipment manufacturers, end-users and customers, suppliers, joint venture partners and others with whom we do business; the ability to realize targeted expense reductions from headcount reductions, facility closures and other cost reduction efforts; the ability to realize cost savings and operational, sales and sourcing improvements and efficiencies, and other expected benefits from transformation initiatives, on a timely basis; the overall success of, and the ability to integrate, newly-acquired businesses and joint ventures, maintain and develop their customers, and achieve synergies and other expected benefits and cost savings therefrom; capacity levels and efficiencies, within facilities, within major product markets and within the industries in which we participate as a whole; the effect of disruption in the business of suppliers, customers, facilities and shipping operations due to adverse weather, casualty events, equipment breakdowns, labor shortages, interruption in utility services, civil unrest, international conflicts, terrorist activities or other causes; changes in customer demand, inventories, spending patterns, product choices, and supplier choices; risks associated with doing business internationally, including economic, political and social instability, foreign currency exchange rate exposure and the acceptance of our products in global markets; the ability to improve and maintain processes and business practices to keep pace with the economic, competitive and technological environment; the effect of inflation, interest rate increases and economic recession, which may negatively impact our operations and financial results; deviation of actual results from estimates and/or assumptions used in the application of its significant accounting policies; the level of imports and import prices in our markets; the impact of environmental laws and regulations or the actions of the United States Environmental Protection Agency or similar regulators which increase costs or limit our ability to use or sell certain products; the impact of increasing environmental, greenhouse gas emission and sustainability regulations and considerations; the impact of judicial rulings and governmental regulations, both in the United States and abroad, including those adopted by the United States Securities and Exchange Commission and other governmental agencies as contemplated by the Coronavirus Aid, Relief and Economic Security (CARES) Act, the Consolidated Appropriations Act, 2021, the American Rescue Plan Act of 2021, and the Dodd-Frank Wall Street Reform and Consumer Protection Act of 2010; the effect of healthcare laws in the United States and potential changes for such laws, which may increase our healthcare and other costs and negatively impact our operations and financial results; the effects of tax laws in the United States and potential changes for such laws, which may increase our costs and negatively impact our operations and financial results; cyber security risks; the effects of privacy and information security laws and standards; and other risks described from time to time in our filings with the United States Securities and Exchange Commission, including those described in “Part I – Item 1A. – Risk Factors” of the Annual Report on Form 10-K for the fiscal year ended May 31, 2026.

Forward-looking statements should be construed in the light of such risks. We note these factors for investors as contemplated by the Act. It is impossible to predict or identify all potential risk factors. Consequently, readers should not consider the foregoing list to be a complete set of all potential risks and uncertainties. Readers are cautioned not to place undue reliance on any forward-looking statements, which speak only as of the date made. We do not undertake, and hereby disclaim, any obligation to update any forward-looking statements, whether as a result of new information, future developments or otherwise, except as required by applicable law.

       
WORTHINGTON ENTERPRISES, INC.
CONSOLIDATED STATEMENTS OF EARNINGS
(In thousands, except per common share amounts)
       
    Three Months Ended  
    August 31,  
    2026     2025  
Net sales   $ 343,886     $ 303,707  
Cost of goods sold     252,988       221,423  
Gross profit     90,898       82,284  
Selling, general and administrative expense     77,158       70,565  
Restructuring and other expense, net     717       2,476  
Operating income     13,023       9,243  
Other income (expense):            
Miscellaneous income (expense), net     4,081       (156 )
Interest expense, net     (2,097 )     (63 )
Equity in net income of unconsolidated affiliates     40,594       36,657  
Earnings before income taxes     55,601       45,681  
Income tax expense     13,029       10,860  
Net earnings     42,572       34,821  
Net loss attributable to noncontrolling interest     –       (327 )
Net earnings attributable to controlling interest   $ 42,572     $ 35,148  
             
Basic            
Weighted average common shares outstanding     48,568       49,264  
Earnings per share attributable to controlling interest   $ 0.88     $ 0.71  
             
Diluted            
Weighted average common shares outstanding     49,165       50,026  
Earnings per share attributable to controlling interest   $ 0.87     $ 0.70  
             
Cash dividends declared per common share   $ 0.20     $ 0.19  
                 

WORTHINGTON ENTERPRISES, INC.
CONSOLIDATED BALANCE SHEETS
(In thousands)
             
    August 31,     May 31,  
    2026     2026  
Assets            
Current assets:            
Cash and cash equivalents   $ 55,067     $ 27,725  
Receivables, less allowances of $1,290 and $1,310, respectively     185,659       228,168  
Inventories            
Raw materials     119,778       110,536  
Work in process     11,292       9,490  
Finished products     91,515       87,270  
Total inventories     222,585       207,296  
Income taxes receivable     10,342       20,016  
Prepaid expenses and other current assets     49,054       41,269  
Total current assets     522,707       524,474  
Investments in unconsolidated affiliates     119,639       118,048  
Operating lease assets     40,979       42,888  
Goodwill     499,116       500,784  
Other intangible assets, net of accumulated amortization of $112,044 and $106,944, respectively     317,172       322,761  
Other assets     28,009       28,215  
Property, plant and equipment:            
Land     8,728       8,732  
Buildings and improvements     136,370       136,441  
Machinery and equipment     406,857       411,030  
Construction in progress     75,275       66,509  
Total property, plant and equipment     627,230       622,712  
Less: accumulated depreciation     314,102       311,818  
Total property, plant and equipment, net     313,128       310,894  
Total assets   $ 1,840,750     $ 1,848,064  
             
Liabilities and equity            
Current liabilities:            
Accounts payable   $ 105,525     $ 115,203  
Accrued compensation, contributions to employee benefit plans and related taxes     36,635       41,728  
Dividends payable     10,194       9,814  
Other accrued items     34,572       45,832  
Current operating lease liabilities     7,970       7,982  
Income taxes payable     1,151       867  
Total current liabilities     196,047       221,426  
Other liabilities     56,834       56,657  
Distributions in excess of investment in unconsolidated affiliate     102,293       105,349  
Long-term debt     305,552       305,896  
Noncurrent operating lease liabilities     34,028       35,883  
Deferred income taxes, net     98,804       95,813  
Total liabilities     793,558       821,024  
Shareholders’ equity     1,047,192       1,027,040  
Total liabilities and equity   $ 1,840,750     $ 1,848,064  
                 

WORTHINGTON ENTERPRISES, INC.
CONSOLIDATED STATEMENTS OF CASH FLOWS
(In thousands)
       
    Three Months Ended  
    August 31,  
    2026     2025  
Operating activities:            
Net earnings   $ 42,572     $ 34,821  
Adjustments to reconcile net earnings to net cash provided by operating activities:            
Depreciation and amortization     15,628       13,086  
Provision for deferred income taxes     3,030       2,957  
Bad debt income     (134 )     (21 )
Equity in net income of unconsolidated affiliates, net of distributions     (4,743 )     (181 )
Net gain on sale of assets     (3,972 )     –  
Stock-based compensation     3,996       3,427  
Unrealized gain on investment in marketable securities     (20 )     –  
Changes in assets and liabilities, net of impact of acquisitions:            
Receivables     41,900       14,107  
Inventories     (15,289 )     (15,816 )
Accounts payable     (8,874 )     (11,946 )
Accrued compensation and employee benefits     (5,092 )     (10,399 )
Other operating items, net     (2,271 )     11,026  
Net cash provided by operating activities     66,731       41,061  
             
Investing activities:            
Investment in property, plant and equipment     (12,754 )     (13,195 )
Acquisitions, net of cash acquired     (2,393 )     (92,235 )
Proceeds from sale of assets, net of selling costs     1,030       –  
Net cash used by investing activities     (14,117 )     (105,430 )
             
Financing activities:            
Dividends paid     (9,402 )     (8,576 )
Purchase of common shares     (18,212 )     (6,259 )
Principal payments on long-term obligations     (318 )     (197 )
Proceeds from issuance of common shares, net of tax withholdings     2,660       (3,552 )
Net cash used by financing activities     (25,272 )     (18,584 )
Increase (decrease) in cash and cash equivalents     27,342       (82,953 )
Cash and cash equivalents at beginning of period     27,725       250,075  
Cash and cash equivalents at end of period   $ 55,067     $ 167,122  
                 

WORTHINGTON ENTERPRISES, INC.
SEGMENT INFORMATION
(Dollars in thousands)
       
    Three Months Ended  
    August 31,  
    2026     2025  
Net sales            
Building Performance Solutions   $ 215,087     $ 184,769  
Trade & Specialty Solutions     128,799       118,938  
Consolidated   $ 343,886     $ 303,707  
             
Adjusted EBITDA            
Building Performance Solutions   $ 59,782     $ 59,944  
Trade & Specialty Solutions     24,014       16,148  
Total reportable segments     83,796       76,092  
Other (1)     (1,839 )     (1,663 )
Unallocated Corporate     (7,938 )     (7,218 )
Consolidated   $ 74,019     $ 67,211  
             
Adjusted EBITDA margin            
Building Performance Solutions     27.8 %     32.4 %
Trade & Specialty Solutions     18.6 %     13.6 %
Consolidated     21.5 %     22.1 %
             
Equity income by unconsolidated affiliate            
WAVE (1)   $ 35,051     $ 32,386  
ClarkDietrich (1)     7,382       5,934  
Other (2)     (1,839 )     (1,663 )
Consolidated   $ 40,594     $ 36,657  
_______________

(1) Equity income contributed by the WAVE and ClarkDietrich joint ventures is included in Building Performance Solutions segment results.

(2) Other includes the equity in net income of unconsolidated affiliates of the Workhorse and heiserTEC (formerly referred to as the Sustainable Energy Solutions joint venture) joint ventures.

 
WORTHINGTON ENTERPRISES, INC.
GAAP / NON-GAAP RECONCILIATIONS
(Dollars in thousands, except per share amounts)
 

For more information regarding the non-GAAP financial measures, refer to the “Use of Non-GAAP Financial Measures and Definitions” section of this release.

Consolidated Results – Adjusted Earnings per Share – Diluted

  Three Months Ended August 31, 2026  
  Operating
Income
    Earnings
Before
Income
Taxes
    Income
Tax
Expense
    Net
Earnings (1)
    Diluted
EPS (1)
 
GAAP $ 13,023     $ 55,601     $ 13,029     $ 42,572     $ 0.87  
Restructuring and other expense, net   717       717       (174 )     543       0.01  
Non-cash gains in miscellaneous income, net (2)   –       (4,020 )     977       (3,043 )     (0.06 )
Non-GAAP $ 13,740     $ 52,298     $ 12,226     $ 40,072     $ 0.82  
                                       

  Three Months Ended August 31, 2025  
  Operating
Income
    Earnings
Before
Income
Taxes
    Income
Tax
Expense
    Net
Earnings (1)
    Diluted
EPS (1)
 
GAAP $ 9,243     $ 45,681     $ 10,860     $ 35,148     $ 0.70  
Amortization of inventory step-up (3)   2,151       2,151       (513 )     1,638       0.04  
Restructuring and other expense, net   2,476       2,476       (377 )     2,099       0.04  
Non-GAAP $ 13,870     $ 50,308     $ 11,750     $ 38,885     $ 0.78  
                                       

Consolidated Results – Adjusted EBITDA

    Three Months Ended  
    August 31,  
    2026     2025  
Net earnings (GAAP)   $ 42,572     $ 34,821  
Plus: Net loss attributable to noncontrolling interest     –       327  
Net earnings attributable to controlling interest     42,572       35,148  
Interest expense, net     2,097       63  
Income tax expense     13,029       10,860  
EBIT (4)     57,698       46,071  
Amortization of inventory step-up (3)     –       2,151  
Restructuring and other expense, net     717       2,476  
Non-cash gains in miscellaneous income, net (2)     (4,020 )     –  
Adjusted EBIT (4)     54,395       50,698  
Depreciation and amortization     15,628       13,086  
Stock-based compensation     3,996       3,427  
Adjusted EBITDA (non-GAAP)   $ 74,019     $ 67,211  
             
Net earnings margin (GAAP)     12.4 %     11.5 %
Adjusted EBITDA margin (non-GAAP)     21.5 %     22.1 %
_______________                

(1) Excludes the impact of noncontrolling interest.

(2) Includes a pre-tax gain of $4,000 during the first quarter of fiscal 2027 related to an earnout arrangement associated with the sale of the company’s former oil and gas products business, which was divested in January 2021.

(3) Reflects the amortization of the step-up to fair market value of acquired inventory related to the Elgen acquisition in fiscal 2026.

(4) EBIT and adjusted EBIT are non-GAAP financial measures. However, these measures are not used by management to evaluate our performance, engage in financial and operational planning, or to determine incentive compensation. Instead, they are included as subtotals in the reconciliation of net earnings to adjusted EBITDA, which is a non-GAAP financial measure used by management.

Consolidated Results – Free Cash Flow

The following table provides a reconciliation of net cash provided by operating activities to free cash flow and the calculation of operating cash flow conversion and free cash flow conversion for the periods presented.

       
    Three Months Ended  
    August 31,  
    2026     2025  
Net cash provided by operating activities (GAAP)   $ 66,731     $ 41,061  
Investment in property, plant, and equipment     (12,754 )     (13,195 )
Free cash flow (non-GAAP)   $ 53,977     $ 27,866  
             
Net earnings attributable to controlling interest (GAAP)   $ 42,572     $ 35,148  
Adjusted net earnings attributable to controlling interest (non-GAAP)   $ 40,072     $ 38,885  
             
Operating cash flow conversion (GAAP) (1)     157 %     117 %
Free cash flow conversion (non-GAAP)     135 %     72 %
_______________                

(1) Operating cash flow conversion is defined as net cash provided by operating activities divided by net earnings attributable to controlling interest.

 
WORTHINGTON ENTERPRISES, INC.
USE OF NON-GAAP FINANCIAL MEASURES AND DEFINITIONS
 

NON-GAAP FINANCIAL MEASURES. These materials include certain financial measures that are not calculated and presented in accordance with accounting principles generally accepted in the United States (“GAAP”). Non-GAAP financial measures typically exclude items that management believes are not reflective of, and thus should not be included when evaluating the performance of our ongoing operations. Management uses these non-GAAP financial measures to evaluate ongoing performance, engage in financial and operational planning, and determine incentive compensation. Management believes these non-GAAP financial measures provide useful supplemental information regarding the performance of our ongoing operations and should not be considered as an alternative to the comparable GAAP financial measure. Additionally, management believes these non-GAAP financial measures allow for meaningful comparisons and analysis of trends in our businesses and enables investors to evaluate operations and future prospects in the same manner as management.

The following provides an explanation of each non-GAAP financial measure presented in these materials:

Adjusted operating income (loss) is defined as operating income (loss) excluding the items listed below, to the extent naturally included in operating income (loss).

Adjusted net earnings is defined as net earnings attributable to controlling interest excluding the after-tax effect of the excluded items outlined below.

Adjusted EPS – diluted is defined as adjusted net earnings divided by diluted weighted-average common shares outstanding for the applicable period.

Adjusted EBITDA is the measure by which we evaluate segment performance and our overall profitability. EBITDA is defined as earnings before interest, taxes, depreciation, and amortization. Adjusted EBITDA excludes additional items including, but not limited to, those listed below, as well as other items that management believes are not reflective of, and thus should not be included when evaluating the performance of our ongoing operations. Adjusted EBITDA also excludes stock-based compensation due to its non-cash nature, which is consistent with how management assesses operating performance and determines incentive compensation. At the segment level, adjusted EBITDA includes expense allocations for centralized corporate back-office functions that exist to support the day-to-day business operations. Public company and other governance costs are held at the corporate level within the unallocated corporate and other category.

Adjusted EBITDA margin is calculated by dividing adjusted EBITDA by net sales.

Free cash flow is a non-GAAP financial liquidity measure that is used to assess our ability to generate cash beyond what is required for our business operations and capital expenditures. We define free cash flow as net cash flows from operating activities less investment in property, plant, and equipment.

Free cash flow conversion is a non-GAAP financial measure that is used to measure how much of our adjusted net earnings attributable to controlling interest is converted into cash. We define free cash flow conversion as free cash flow divided by adjusted net earnings.

EXCLUSIONS FROM NON-GAAP FINANCIAL MEASURES

Management believes it is useful to exclude the following items from its non-GAAP financial measures for its own and investors’ assessment of the business for the reasons identified below. Additionally, management may exclude other items from non-GAAP financial measures that do not occur in the ordinary course of our ongoing business operations and note them in the reconciliation from net earnings to the non-GAAP financial measure adjusted EBITDA.

  • Amortization of inventory step-up represents the increase in inventory fair value associated with our acquisitions. The increase in inventory fair value is amortized to cost of sales over the period that the related inventory is sold. The amortization of inventory step-up is excluded because it is a non-cash expense that is not indicative of ongoing operating results.
  • Impairment charges are excluded because they do not occur in the ordinary course of our ongoing business operations, are inherently unpredictable in timing and amount, and are non-cash, which management believes facilitates the comparison of historical, current and forecasted financial results.
  • Restructuring activities consist of established programs that are intended to fundamentally change our operations, and as such are excluded from its non-GAAP financial measures. Our restructuring programs may include closing or consolidating production facilities or moving manufacturing of a product to another location, realignment of the management structure of a business unit in response to changing market conditions or general rationalization of headcount. Our restructuring activities generally give rise to employee-related costs, such as severance pay, and facility-related costs, such as exit costs and gains or losses on asset disposals but may include other incremental costs associated with our restructuring activities. Restructuring and other expense, net, may also include other nonrecurring items included in operating income but incremental to our normal business activities. These items are excluded because they are not indicative of the ongoing operations of our underlying business.
  • Non-cash (gains) losses in miscellaneous (income) expense are excluded due to their non-cash nature and the fact that they do not occur in the normal course of business and may obscure analysis of trends and financial performance.

Sonya L. Higginbotham
Senior Vice President
Chief of Corporate Affairs, Communications and Sustainability
614.438.7391
sonya.higginbotham@wthg.com

Marcus A. Rogier
Treasurer and Investor Relations Officer
614.840.4663
marcus.rogier@wthg.com

200 Old Wilson Bridge Rd.
Columbus, Ohio 43085
WorthingtonEnterprises.com

Privacy Overview

This website uses cookies so that we can provide you with the best user experience possible. Cookie information is stored in your browser and performs functions such as recognising you when you return to our website and helping our team to understand which sections of the website you find most interesting and useful.