Xcelsior CNG Bus

Xcelsior CNG Bus
Xcelsior CNG Bus


Approximately $93 million investment advances fleet modernization efforts while continuing a relationship that has supported public transportation across the Houston region since 1991

ST. CLOUD, Minn., Sept. 17, 2026 (GLOBE NEWSWIRE) — (TSX: NFI, OTC: NFYEF, TSX: NFI.DB) NFI Group Inc. (NFI), a leading manufacturer of buses and motorcoaches and a provider of comprehensive aftermarket parts and service solutions, subsidiary New Flyer of America Inc. (New Flyer), today announced an order from the Houston Metropolitan Transit Authority (METRO) for 100 Xcelsior® 40-foot compressed natural gas buses. The order was added to New Flyer’s firm backlog in the second quarter of 2026.

The purchase, valued at approximately $93 million, is supported by funding from the Federal Transit Administration’s (FTA) 2025-2026 Low- or No-Emission (Low-No) Program and Bus and Bus Facilities Projects. The new buses will replace end-of-life vehicles, helping METRO support efficient, lower-emission transit service across the Houston region. The initiative is being undertaken in conjunction with upgrades to select METRO facilities that will increase compressed natural gas (CNG) fueling capacity.

“For more than 30 years, METRO and NFI have worked together to support safe, dependable transit for the Houston region,” said Chris Stoddart, President, North American Bus and Coach, NFI. “We’re honored to continue that partnership with New Flyer Xcelsior CNG buses that will help enhance service for riders, support METRO’s ongoing fleet renewal efforts, and continue advancing cleaner public transportation solutions for the communities it serves.”

METRO is the primary public transportation provider in the Houston region, delivering safe, reliable, and integrated mobility solutions across the City of Houston, most of Harris County, and surrounding communities. Since beginning operations in 1979, METRO has evolved into a comprehensive, multimodal system spanning approximately 1,300 miles, connecting millions of residents to employment centers, education, healthcare, and essential services through an extensive network of bus, light rail, and accessible transit options.

Today, METRO serves a population of approximately four million people and provides more than 76 million passenger trips annually, playing a pivotal role in supporting mobility and economic growth in one of North America’s largest metropolitan regions. Bus service forms the backbone of the system, accounting for the majority of the ridership and enabling frequent, high-capacity connections across the region’s diverse communities.

“CNG allows METRO to deliver the reliable service our customers depend on while operating a cleaner, more efficient fleet,” said Kurt Luhrsen, Interim COO at METRO. “As we replace aging buses, we have an opportunity to reduce emissions and make responsible choices that benefit both our riders and the Houston region. CNG is an important part of that commitment.”

This latest order further strengthens the longstanding relationship between NFI and METRO, which has included New Flyer transit buses and MCI motorcoaches since 1991. Together, the organizations continue working to support essential transportation services, system investment, and improved transit access across the Houston metropolitan region.

About NFI

NFI is a leading global bus and motorcoach manufacturer and a provider of aftermarket parts and service solutions. With more than 9,000 team members across ten countries and operations spanning over 40 facilities, NFI delivers a comprehensive portfolio of bus and coach platforms.

Through its brands New Flyer® (heavy-duty transit buses), MCI® (motorcoaches), Alexander Dennis Limited (single- and double-deck buses), ARBOC® (low-floor cutaway and medium-duty buses), and NFI Parts™, NFI supports a diverse and extensive portfolio, serving public transit, commuter, and coach markets. In total, NFI supports an installed base of more than 100,000 buses and coaches worldwide. NFI offers a broad range of propulsion systems, including zero-emission electric (referring to propulsion systems that do not utilize internal combustion engines, such as trolley, battery, and fuel cell), natural gas, electric hybrid, and advanced diesel technologies, providing agencies with multiple fleet technology options. NFI’s common shares trade on the Toronto Stock Exchange (TSX: NFI) and its convertible unsecured debentures trade under the symbol NFI.DB. News and information is available at www.nfigroup.com, www.newflyer.com, www.mcicoach.com, nfi.parts, www.alexander-dennis.com, arbocsv.com, and carfaircomposites.com.

About New Flyer

New Flyer is North America’s heavy-duty transit bus leader and offers the most advanced product line under the Xcelsior® and Xcelsior CHARGE® brands. It also offers infrastructure development through NFI Infrastructure Solutions™, a service dedicated to providing safe, sustainable, and reliable charging and mobility solutions. New Flyer actively supports over 35,000 heavy-duty transit buses (New Flyer, NABI, and Orion) currently in service, of which 8,600 are powered by electric motors and battery propulsion and 1,900 are zero-emission. Further information is available at www.newflyer.com.

Forward-Looking Statements

This press release may contain forward-looking statements relating to expected future events and financial and operating results of NFI that involve risks and uncertainties. Although the forward-looking statements contained in this press release are based upon what management believes to be reasonable assumptions, investors cannot be assured that actual results will be consistent with these forward-looking statements, and the differences may be material. Actual results may differ materially from management expectations as projected in such forward-looking statements for a variety of reasons, including market and general economic conditions (including as a result of tariffs and other trade measures) and economic conditions of and funding availability for customers to purchase buses and to purchase parts or services (including as a result of recent U.S. policy developments); customers may not exercise options to purchase additional buses; the ability of customers to suspend or terminate contracts for convenience; production may be delayed or production rates may be decreased as a result of ongoing and future supply chain disruptions and shortages of parts and components, shipping and freight delays, and disruption to and shortage of labor supply; and the other risks and uncertainties discussed in the materials filed with the Canadian securities regulatory authorities and available on SEDAR at www.sedarplus.ca.  

Due to the potential impact of these factors, NFI disclaims any intention or obligation to update or revise any forward-looking statements, whether as a result of new information, future events or otherwise, unless required by applicable law. 

For media inquiries, please contact: 
Melissa Schnee 
P: 385.910.6861 
Melissa_Schnee@newflyer.com 

For investor inquiries, please contact: 
Stephen King 
P: 204.792.1300 
Stephen.King@nfigroup.com 

A photo accompanying this announcement is available at https://www.globenewswire.com/NewsRoom/AttachmentNg/296fd9f9-75eb-48f1-8124-e3f769ae17e9

This press release was published by a CLEAR® Verified individual.

ATLANTA, Sept. 17, 2026 (GLOBE NEWSWIRE) — Atlanticus Holdings Corporation (NASDAQ: ATLC) (“Atlanticus,” the “Company,” “we,” “our” or “us”), a financial technology company that enables its bank, retail and healthcare partners to offer more inclusive financial services to millions of everyday Americans, today announced that it has completed the sale of its CAR Auto Finance operations (“CAR”) to an unaffiliated third party.

CAR comprised 100% of the Company’s Auto Finance segment. Following the transaction, Atlanticus will no longer operate an Auto Finance segment. Total consideration to Atlanticus was approximately $71.2 million, consisting of $56.2 million in cash and a $15.0 million seller note. Approximately 154 team members associated with CAR are transitioning to the buyer in connection with the transaction.

“We are pleased to announce the completion of the sale of CAR,” said Jeff Howard, President and Chief Executive Officer of Atlanticus. “CAR has been a valuable part of Atlanticus for many years, and I want to thank the entire CAR team for their many contributions to our success. The transaction strengthens our balance sheet and allows us to concentrate our capital and management resources on the consumer credit products where we see the greatest opportunities for long-term value creation and growth.”

Atlanticus expects to use the cash proceeds from the sale to reduce debt and invest in higher-growth product lines.

About Atlanticus Holdings Corporation

Empowering Better Financial Outcomes for Everyday Americans

Atlanticus Holdings Corporation empowers better financial outcomes for Everyday Americans by enabling bank, retail, and healthcare partners to offer more inclusive financial solutions to consumers. Leveraging proprietary technology and advanced analytics, Atlanticus applies more than 30 years of operating experience, servicing over 23 million customers and more than $53 billion in consumer loans, to support lenders across a broad range of consumer credit products. These offerings span retail and healthcare private-label credit and general purpose credit cards, through an omnichannel platform, including strategic partnerships.

Atlanticus is guided by the principles of responsible lending, smart innovation, and expanding access to credit for consumers working toward a stronger financial future.

Forward-Looking Statements

This press release contains forward-looking statements that reflect the Company’s current views regarding, among other things, the expected transition of employees, the Company’s intended use of proceeds from the transaction, capital allocation and future investment and growth opportunities. These statements are subject to certain risks and uncertainties that could cause actual results to differ materially from those included in the forward-looking statements. These risks and uncertainties include those risks described in the Company’s filings with the Securities and Exchange Commission. The forward-looking statements speak only as of the date on which they are made, and, except to the extent required by federal securities laws, the Company disclaims any obligation to update any forward-looking statement to reflect events or circumstances after the date on which the statement is made or to reflect the occurrence of unanticipated events. In light of these risks and uncertainties, there is no assurance that the events or results suggested by the forward-looking statements will in fact occur, and you should not place undue reliance on these forward-looking statements.

Contact:
Investor Relations, investors@atlanticus.com
Dan Mauch, daniel.mauch@atlanticus.com
Sara Savarino, sara.savarino@atlanticus.com

  • Stock Locate Fees Grow More Than 20-Fold to Approximately $6.8 Million; Commissions Up Approximately 56%
  • Non-Commission Revenue Lines Now Represent Approximately 54% of Total Revenues, Up From 45% in Fiscal 2025
  • Second Consecutive Year of Positive Net Income; Cash More Than Doubles to Approximately $15.4 Million; Stockholders’ Equity of Approximately $21.1 Million
  • AtlasClearing Net Capital Up Approximately 28% Year-over-Year to $14.4 Million
  • Six New Correspondent Broker-Dealers Signed; Revenue from These Relationships Not Yet Reflected in Results
  • Growth Achieved Without At-the-Market or Equity Line Financing; No Dilutive Capital Raise Since October 2025

TAMPA, Fla., Sept. 17, 2026 (GLOBE NEWSWIRE) — AtlasClear Holdings, Inc. (NYSE American: ATCH) (“AtlasClear” or the “Company”), a company building regulated financial infrastructure for smaller institutions, fintechs and advisors, today announced select preliminary unaudited financial results for the fiscal year ended June 30, 2026.

Revenue

Based on preliminary unaudited results, AtlasClear expects to report fiscal 2026 total revenues of approximately $20.1 million, an increase of approximately 85% from $10.9 million in fiscal 2025. The Company also expects to report interest income of approximately $1.8 million, which is presented in other income under GAAP. Total revenues plus interest income are expected to be approximately $21.9 million, compared with approximately $12.9 million in fiscal 2025, an increase of approximately 70%. The separate audited financial statements of the Company’s broker-dealer subsidiary, AtlasClearing, Inc., for the fiscal year ended June 30, 2026, filed with the SEC on August 31, 2026, present interest income within revenues and report total revenues of approximately $21.8 million.

Growth came from both the core commission business and newer business lines. Commission revenue increased approximately 56% to approximately $9.3 million. Stock locate fees, a business the Company launched and scaled during fiscal 2026, increased to approximately $6.8 million from approximately $0.3 million and represented approximately 34% of total revenues. Net gains on firm trading accounts contributed approximately $0.5 million. As a result, commission revenue grew in absolute dollars while declining from approximately 55% of total revenues in fiscal 2025 to approximately 46% in fiscal 2026, and non-commission revenue lines represented approximately 54% of the total.

Profitability and Balance Sheet

The Company expects to report net income of approximately $2.0 million for fiscal 2026, its second consecutive year of positive net income, which includes non-cash gains from changes in the fair value of the Company’s financial instruments. At June 30, 2026, the Company expects to report cash and cash equivalents of approximately $15.4 million, more than double the $7.5 million a year earlier; total stockholders’ equity of approximately $21.1 million, compared with a stockholders’ deficit of approximately $6.8 million at June 30, 2025; and total liabilities of approximately $50.1 million, a reduction of approximately $17.6 million.

Net capital at AtlasClearing, Inc. increased to approximately $14.4 million at June 30, 2026 from $11.2 million a year earlier, as reported in AtlasClearing’s audited annual report filed with the SEC. That is approximately $14.1 million above its minimum requirement and well above the $10 million excess net capital threshold that the National Securities Clearing Corporation requires of firms that clear for introducing brokers. Net capital is stated after deducting unsecured receivables from other broker-dealers for stock locate fees, which are treated as non-allowable assets until collected and have grown with the stock locate business.

Correspondent Pipeline and Capital Discipline

AtlasClearing has signed clearing agreements with six new correspondent broker-dealers, which are in various stages of onboarding and conversion. Fiscal 2026 results include no meaningful revenue from these relationships, which the Company expects to begin contributing as conversions are completed during fiscal 2027.

Fiscal 2026 growth was achieved without reliance on at-the-market or equity line financing. The Company sold no shares under its equity line facility during fiscal 2026 and has not conducted any at-the-market offering or other dilutive capital raise since its October 2025 institutional unit financing. Shares outstanding were approximately 150.3 million at June 30, 2026 and approximately 151.8 million as of the date of this release.

Management Commentary

“Fiscal 2026 was a breakout year for AtlasClear. Revenue increased approximately 85% to roughly $20.1 million, and including interest income the business generated approximately $21.9 million,” said John Schaible, Executive Chairman of AtlasClear Holdings. “Just as important is how we got there. More than half of our revenue now comes from lines of business that barely existed two years ago, and we did it without an at-the-market program or an equity line. We finished the year with more than twice the cash, stockholders’ equity of more than $21 million, and a stronger broker-dealer. That is the foundation we intend to build on as we continue to pursue our bank strategy, and we look forward to updating shareholders in greater detail on our full-year results and operations later this month.”

“The operating story at AtlasClearing is one of execution,” said Craig Ridenhour, President of AtlasClear Holdings and Chairman of AtlasClearing, Inc. “Commissions grew more than 50%, stock locate went from a standing start to nearly $7 million, and net capital finished the year up more than $3 million. Six new correspondents have signed and none of their revenue is in these numbers yet. As those correspondents onboard, the customer assets and trading activity they bring will give us the ability to scale our stock loan business and to add new forms of interest income, including on margin balances, customer cash and securities lending, on the platform and team we already have in place, with only incremental expense.”

Preliminary Results

The preliminary financial results included in this release have been prepared by, and are the responsibility of, the Company’s management. These results are preliminary and unaudited and are subject to completion of the Company’s financial closing procedures and audit. Actual results may differ from the preliminary results presented above, and any such differences could be material. These preliminary results should not be viewed as a substitute for the Company’s full audited consolidated financial statements. Total revenues plus interest income, as used in this release, is a supplemental measure that is not calculated in accordance with GAAP. It is the sum of total revenues and interest income, each as the Company expects to report them in its consolidated statement of operations, and is presented because interest earned on balances held by the Company’s broker-dealer subsidiary is an integral part of its operating economics. It should not be considered a substitute for total revenues determined in accordance with GAAP.

Fiscal 2026 Results and Conference Call

AtlasClear expects to file its Annual Report on Form 10-K for the fiscal year ended June 30, 2026 and report its full fiscal 2026 financial results by September 28, 2026. The Company also expects to host a conference call to discuss its fiscal 2026 results by September 28, 2026. Additional details regarding the conference call will be provided in advance.

About AtlasClear Holdings, Inc.

AtlasClear Holdings, Inc. (NYSE American: ATCH) is building a technology-enabled financial services platform designed for trading, clearing, settlement, and banking for emerging financial institutions and fintechs. Through its wholly owned subsidiary AtlasClearing, Inc. (formerly Wilson-Davis & Co., Inc.), a full-service correspondent broker-dealer registered with the SEC and FINRA, and its planned acquisition of Commercial Bancorp of Wyoming, AtlasClear Holdings seeks to deliver a vertically integrated suite of brokerage, clearing, risk management, regulatory, and commercial banking solutions. For more information, follow us on LinkedIn or X and visit www.atlasclear.com.

To stay up to date on AtlasClear’s platform strategy and market perspective, subscribe to the Company’s YouTube channel and watch the Clearing the View by AtlasClear video series.

Forward-Looking Statements

This communication contains forward-looking statements within the meaning of the Private Securities Litigation Reform Act of 1995, as amended, that reflect AtlasClear Holdings’ current views with respect to, among other things, its future operations and financial performance. Forward-looking statements in this communication may be identified by the use of words such as “anticipate,” “assume,” “believe,” “continue,” “could,” “estimate,” “expect,” “future,” “intend,” “may,” “outlook,” “plan,” “potential,” “predict,” “project,” “seek,” “should,” “target,” “will,” “would,” and similar expressions.

Forward-looking statements include, but are not limited to, statements regarding the Company’s preliminary unaudited financial results for the fiscal year ended June 30, 2026, expected future growth, strategic initiatives, the onboarding and conversion of the Company’s newly signed correspondent broker-dealers and the timing and revenue contribution of those relationships, the Company’s future financing activities, the expansion of the Company’s stock locate, securities lending and margin businesses, the expected timing of the filing of the Company’s Annual Report on Form 10-K for the fiscal year ended June 30, 2026 and the matters to be reported therein, the proposed acquisition of an institutional digital asset business and the proposed acquisitions of Ark Financial Services, Inc. and the Target, the anticipated timing and completion of the initial and second closings of the Dawson James transaction, the execution of definitive documentation, receipt of FINRA and other required regulatory and stockholder approvals, the anticipated growth of Dawson James’s clearing activity through AtlasClearing, the expected revenue, net income and EBITDA contributions of the proposed acquisitions, the timing of any disclosure of the Target’s identity, the Company’s intention to refile its application to acquire Commercial Bancorp of Wyoming, future financial performance, future capital markets activity, and the Company’s ability to execute on its business strategy. The letter of intent for the digital asset acquisition and the amended Dawson James letter of intent are non-binding (other than certain customary provisions), and there can be no assurance that definitive agreements will be executed or that the proposed acquisitions will be completed on the terms described, or at all.

These statements are based on current expectations and assumptions that are subject to risks and uncertainties, many of which are beyond the Company’s control, and actual results may differ materially from those anticipated. Factors that could cause actual results to differ include, but are not limited to: the risk that the Company’s final audited results for fiscal 2026 differ from the preliminary unaudited results described in this release; AtlasClear’s failure to enter into definitive agreements with the Target or the Dawson James parties, or its failure to complete the proposed acquisitions on favorable terms or at all; failure to receive the required regulatory approvals for the proposed acquisitions; AtlasClear’s inability to integrate, and to realize the benefits of, the proposed acquisitions; the risk that AtlasClear does not refile its application for the acquisition of Commercial Bancorp or that the acquisition does not close as a result of the failure to satisfy the conditions to closing such acquisition (including, without limitation, the receipt of approval of Commercial Bancorp’s stockholders and receipt of required regulatory approvals); delays in onboarding correspondent broker-dealers or the failure of correspondent relationships to generate the anticipated revenue; the risk that the Company does not file its Annual Report on Form 10-K within the time period anticipated; changes in general economic or political conditions; changes in the markets that AtlasClear targets; slowdowns in securities or digital asset trading or shifting demand for trading, clearing and settling financial products; and any change in laws applicable to AtlasClear or any regulatory or judicial interpretation thereof. For additional information regarding risks and uncertainties, please refer to the Company’s filings with the Securities and Exchange Commission, including its Annual Report on Form 10-K for the year ended June 30, 2025, as amended, and its Quarterly Report on Form 10-Q for the quarter ended March 31, 2026. AtlasClear undertakes no obligation to update or revise forward-looking statements, except as required by law.

Company Contact:
AtlasClear Holdings, Inc.
Email: AtlasClearIR@atlasclear.com

Investor Relations Contact:
Jeff Ramson, CEO
PCG Advisory, Inc.
Email: jramson@pcgadvisory.com

#FORM 8.3

PUBLIC OPENING POSITION DISCLOSURE/DEALING DISCLOSURE BY
A PERSON WITH INTERESTS IN RELEVANT SECURITIES REPRESENTING 1% OR MORE
Rule 8.3 of the Takeover Code (the “Code”)

1.        KEY INFORMATION

(a)   Full name of discloser: Man Group PLC
(b)   Owner or controller of interests and short positions disclosed, if different from 1(a):
        The naming of nominee or vehicle companies is insufficient. For a trust, the trustee(s), settlor and beneficiaries must be named.
 
(c)   Name of offeror/offeree in relation to whose relevant securities this form relates:
        Use a separate form for each offeror/offeree
Rotork Plc
(d)   If an exempt fund manager connected with an offeror/offeree, state this and specify identity of offeror/offeree:  
(e)   Date position held/dealing undertaken:
        For an opening position disclosure, state the latest practicable date prior to the disclosure
16/09/2026
(f)   In addition to the company in 1(c) above, is the discloser making disclosures in respect of any other party to the offer? NO

2.        POSITIONS OF THE PERSON MAKING THE DISCLOSURE

If there are positions or rights to subscribe to disclose in more than one class of relevant securities of the offeror or offeree named in 1(c), copy table 2(a) or (b) (as appropriate) for each additional class of relevant security.

(a)      Interests and short positions in the relevant securities of the offeror or offeree to which the disclosure relates following the dealing (if any)

Class of relevant security:

0.5p ordinary
  Interests

Short positions
Number % Number %
(1)   Relevant securities owned and/or controlled:        
(2)   Cash-settled derivatives:

15,048,634 1.84 11,271 0.00
(3)   Stock-settled derivatives (including options) and agreements to purchase/sell:        

        TOTAL:

15,048,634 1.84 11,271 0.00

All interests and all short positions should be disclosed.

Details of any open stock-settled derivative positions (including traded options), or agreements to purchase or sell relevant securities, should be given on a Supplemental Form 8 (Open Positions).

(b)      Rights to subscribe for new securities (including directors’ and other employee options)

Class of relevant security in relation to which subscription right exists:  
Details, including nature of the rights concerned and relevant percentages:  

3.        DEALINGS (IF ANY) BY THE PERSON MAKING THE DISCLOSURE

Where there have been dealings in more than one class of relevant securities of the offeror or offeree named in 1(c), copy table 3(a), (b), (c) or (d) (as appropriate) for each additional class of relevant security dealt in.

The currency of all prices and other monetary amounts should be stated.

(a)        Purchases and sales

Class of relevant security Purchase/sale

Number of securities Price per unit

(b)        Cash-settled derivative transactions

Class of relevant security Product description
e.g. CFD
Nature of dealing
e.g. opening/closing a long/short position, increasing/reducing a long/short position
Number of reference securities Price per unit
0.5p ordinary Equity swap Reducing a long position 1,752 4.8425 GBP

(c)        Stock-settled derivative transactions (including options)

(i)        Writing, selling, purchasing or varying

Class of relevant security Product description e.g. call option Writing, purchasing, selling, varying etc. Number of securities to which option relates Exercise price per unit Type
e.g. American, European etc.
Expiry date Option money paid/ received per unit

(ii)        Exercise

Class of relevant security Product description
e.g. call option
Exercising/ exercised against Number of securities Exercise price per unit

(d)        Other dealings (including subscribing for new securities)

Class of relevant security Nature of dealing
e.g. subscription, conversion
Details Price per unit (if applicable)

4.        OTHER INFORMATION

(a)        Indemnity and other dealing arrangements

Details of any indemnity or option arrangement, or any agreement or understanding, formal or informal, relating to relevant securities which may be an inducement to deal or refrain from dealing entered into by the person making the disclosure and any party to the offer or any person acting in concert with a party to the offer:

None

(b)        Agreements, arrangements or understandings relating to options or derivatives

Details of any agreement, arrangement or understanding, formal or informal, between the person making the disclosure and any other person relating to:
(i)   the voting rights of any relevant securities under any option; or
(ii)   the voting rights or future acquisition or disposal of any relevant securities to which any derivative is referenced:

None

(c)        Attachments

Is a Supplemental Form 8 (Open Positions) attached? NO

Date of disclosure: 17/09/2026
Contact name: Graham Keene
Telephone number: +44 20 7144 2259

Public disclosures under Rule 8 of the Code must be made to a Regulatory Information Service.

The Panel’s Market Surveillance Unit is available for consultation in relation to the Code’s disclosure requirements on +44 (0)20 7638 0129.

The Code can be viewed on the Panel’s website at www.thetakeoverpanel.org.uk.

  • Providencia drillhole PVD16 returns 83 meters at 1.74 g/t gold from 9 meters depth, including multiple higher-grade intervals
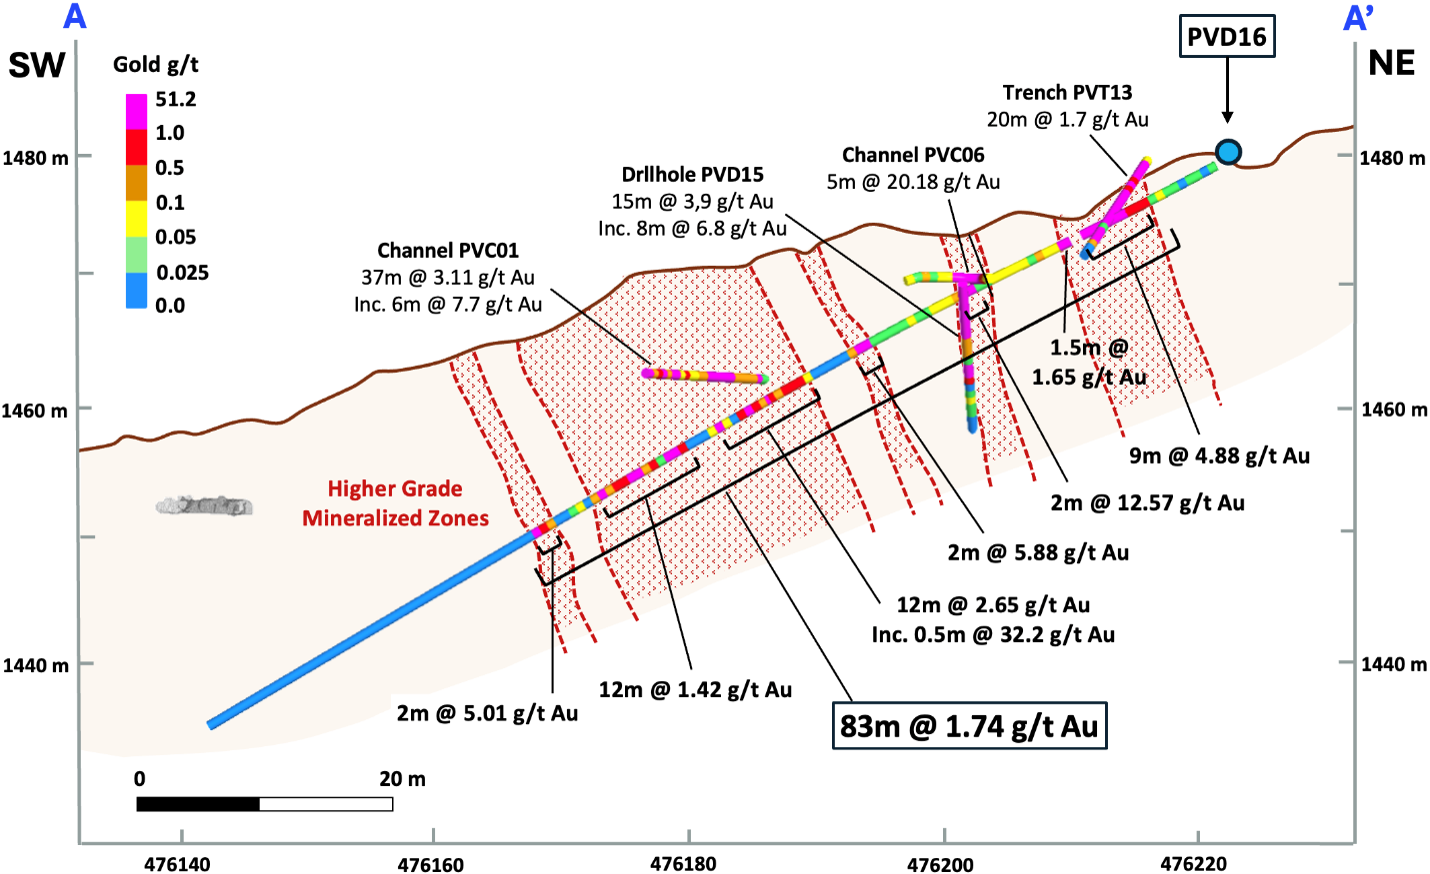
  • Widest high-grade intercept to date includes 4.88 g/t gold over 9 meters, 12.57 g/t gold over 2 meters, 2.65 g/t gold over 12 meters, and a peak of 32.2 g/t gold over 0.5 meters
  • Highlights potential to expand mineralization footprint southwards
  • High-grade mineralization extends to surface, remains open both laterally and at depth

VANCOUVER, British Columbia , Sept. 17, 2026 (GLOBE NEWSWIRE) — Pan Global Resources Inc. (“Pan Global” or the “Company”) (TSXV: PGZ; OTCQB: PGZFF; FRA: 2EU) is pleased to announce exceptional assay results from drillhole PVD16 at the Providencia target (“Providencia”), part of the Company’s 100%-owned Cármenes Project (“Cármenes”) in northern Spain. These results mark the widest high-grade intercept to date in the ongoing Phase 3 drill campaign.

The results reveal a network of steeply-dipping, northerly-trending higher grade gold zones and associated copper, cobalt, nickel platinum and palladium mineralization. The mineralization is within a broader 500 meter (m) x 200 m carbonate breccia system.

Key Highlights from Drillhole PVD16:

  • 83 meters averaging 1.74 g/t gold from 9 meters (downhole) including:
    • 4.88 g/t Au, 0.04% Cu, 0.06% Ni, 0.08% Co, 3.0 g/t Ag, 0.27 g/t Pt and 0.19 g/t Pd over 9 m
    • 12.57 g/t Au over 2 m
    • 5.88 g/t Au over 2 m
    • 2.65 g/t Au over 12 m with a bonanza grade of 32.2 g/t Au over 0.5 m
  • High-grade gold mineralization extends to surface and remains open along strike and at depth
  • Confirms continuation and expansion of gold mineralization beyond previous intercepts, including the 3.9 g/t gold over 15 meters recently reported in drillhole PVD15
  • Gold grades notably increase to the east and south of the historical Providencia mine, indicating potential to expand mineralization footprint southwards
  • Provides further confirmation of potential for significant scale and a high-grade gold zone within, and peripheral to, a multiphase hydrothermal breccia system

“These exceptional results from PVD16 confirm both the scale and continuity of high-grade mineralization at Providencia. The intercept of 83 meters at 1.74 grams per tonne gold from near surface dramatically enhances our confidence in the gold potential of this mineralized system. Results from the on-going Phase 3 drill program increase our confidence that the mineralized zones remain open for expansion in several directions, underscoring potential for a significant discovery,” said Tim Moody, President and CEO of Pan Global.

“As we advance drilling and refine our geological models, our focus is now on testing for extensions of the mineralization at depth, expanding the footprint and identifying additional high-grade zones at Providencia and other high-priority targets in the Cármenes Project.”

Pan Global remains well-capitalized to support expansion of the exploration programs at both Cármenes and the flagship Escacena Project.

Next Steps:

  • Drilling is ongoing at Providencia with two holes remaining in Phase 3
  • Assay results are pending for four additional completed drillholes at Providencia
  • Following completion, drilling will commence at the nearby Profunda Target
  • Surface sampling and geological mapping continues to advance regional targets within Cármenes

Figure 1 – Drillhole PVD16 cross-section with assay results and interpreted higher grade zones; selected nearby results projected onto the section

Figure 1 – Drillhole PVD16 cross-section with assay results

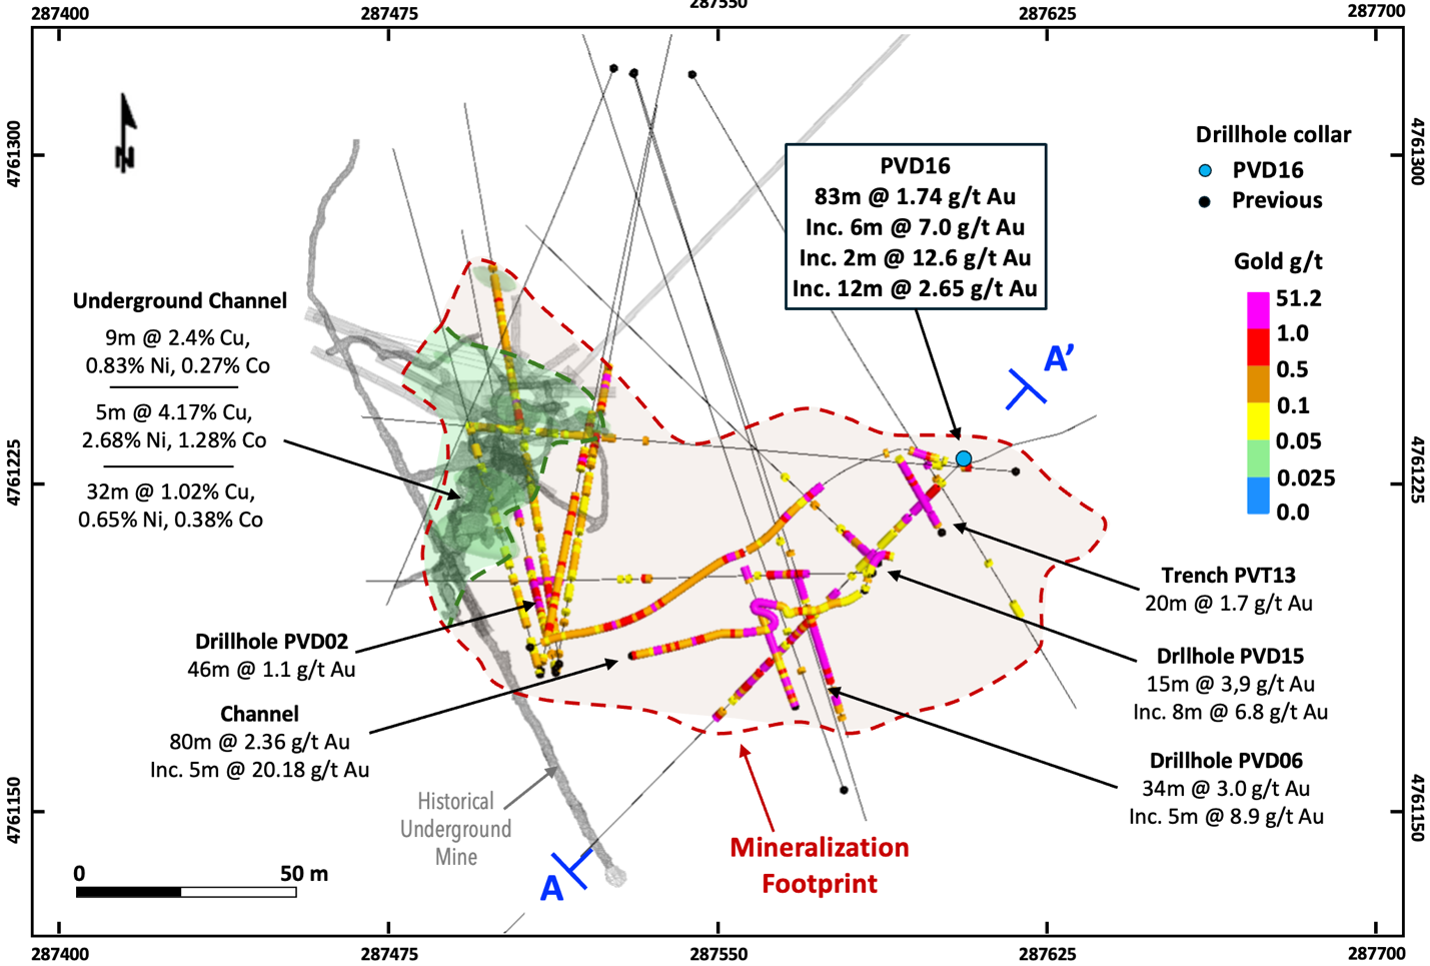
Figure 2 – Providencia target map with drillhole and selected channel sample results, and drillhole PVD16 cross-section A-A’ location (Fig. 1)

Figure 2 – Providencia target map with select drillhole and sample results

Table 1 – Providencia Drillhole PVD16 Results Summary

Drillhole From To Interval1 Au Ag Cu Ni Co
m m m g/t g/t ppm ppm ppm
PVD16 9.0 92.0 83.0 1.74 0.7 85 129 110
including 9.0 18.0 9.0 4.88 3.0 415 579 780
including 12.0 18.0 6.0 7.00 4.4 575 813 1128
including 19.5 21.0 1.5 1.65 0.5 657 1240 635
including 32.0 34.0 2.0 12.57 0.5 33 21 14
including 46.0 48.0 2.0 5.88 0.5 35 15 4
including 55.0 67.0 12.0 2.65 0.8 88 3 3
including 59.7 60.2 0.5 32.20 3.3 59 488 93
including 71.0 83.0 12.0 1.42 0.3 16 14 5
including 90.0 92.0 2.0 5.01 1.6 78 277 41
                 

PVD16 Platinum and Palladium

Drillhole From To Interval1 Pt Pd Pt+Pd
m m m g/t g/t g/t
PVD16 9.0 18.0 9.0 0.27 0.19 0.45
including 12.0 18.0 6.0 0.36 0.26 0.62
  59.7 60.2 0.5 1.4 0.7 2.2
             

Notes:

  1. All reported drill intervals are down-hole lengths. Insufficient drilling has been completed to determine true widths.
  2. The 83-meter continuous interval includes a 1.5-meter interval of missing core resulting from localized core loss during drilling from 18.0 m to 19.5 m. In accordance with QA/QC and industry best practices for public disclosure, the missing interval is assigned an internal dilution value of 0.00 g/t gold within the length-weighted average calculation.
  3. All sub-intervals calculated using a 0.5 g/t lower cut-off and allow three meters consecutive internal dilution. No top-cut is applied.

Table 2 – Drillhole Collar Information

Hole ID Easting1 Northing1 Azimuth (º) Dip (º) Length (m)
PVD16 287606 4761229 224 -28 224.58

1 Coordinate system: UTM30N ERTS89

About the Cármenes Project

The Cármenes Project is located on the southeastern extension of the Rio Narcea Gold Belt approx. 55 km north of León and comprises five Investigation Permits over 5,653 hectares held 100% by Pan Global. The project is approx. 70 km east of Orvana Mineral’s operating El Valle-Boinás/Carlés copper-gold-silver mines and 30 km west of the Salamón Gold Project where the Company was recently notified it was successful in its public tender bid pending an appeal. The Cármenes Project area is highly prospective for multiple bodies or “clusters” of carbonate-hosted hydrothermal breccia style copper, nickel, cobalt, and gold mineralization. The area includes the former Profunda and Providencia mines that last operated in the 1930s, producing concentrates of copper and cobalt with nickel. The Company’s maiden drill program in 2025 at the Providencia target yielded a new gold discovery.

About Pan Global Resources

Pan Global Resources Inc. is actively exploring for copper-rich mineral deposits along with gold and other metals. Copper has compelling supply-demand fundamentals and outlook for strong long-term prices as a critical metal for global electrification and energy transition. Gold is also attracting record prices.

The Company’s flagship Escacena Project, hosting La Romana and Cañada Honda copper-tin-gold mineral resources, is in the prolific Iberian Pyrite Belt in southern Spain, where a favourable permitting track record, excellent infrastructure, mining and professional expertise, and support for copper as a Strategic Raw Material by the European Commission collectively define a tier-one low-risk jurisdiction for mining investment.

The Company’s second project, at Cármenes in northern Spain, is an area with a long mining history and excellent infrastructure. The Pan Global team comprises proven talent in exploration, discovery, development, and mining operations. Pan Global Resources is committed to operating safely and with utmost respect for the environment and our partnered communities. The Company is a member, and operates under the principles, of the United Nations Global Compact.

To learn more about Pan Global Resources, please visit the Company’s Curation Connect showcase and explore AI-generated responses to your enquiries at https://app.curationconnect.com/company/Pan-Global-Resources-44037?utm_source=pg_mediareleases

Qualified Persons

Álvaro Merino, Vice President Exploration for Pan Global Resources and a qualified person as defined by National Instrument 43-101, has approved the scientific and technical information for this media release. Mr. Merino is not independent of the Company.

Sampling, QA/QC and Analytical Procedures

Core size was HQ (63 mm) and all samples were ½ core. Nominal sample size was 1 m core length and ranged from 0.5 to 2 m. Sample intervals were defined using geological contacts with the start and end of each sample physically marked on the core. Diamond blade core cutting and sampling was supervised at all times by Company staff. Duplicate samples of ¼ core were taken approximately every 30 samples, and Certified Reference materials inserted every 25 samples in each batch.

Samples were placed in sealed bags and delivered to the ALS sample preparation facility in Seville in Spain and assayed at the ALS facility in Ireland. All samples were crushed and split (method CRU-31, SPL22Y) and pulverized using (method PUL-31). Gold, platinum and palladium analysis was by 50 gm fire assay with ICP finish (method Au-ICP-24) and multi element analysis was undertaken using a 4-acid digest with ICP AES finish (method ME-ICP-61). Over grade base metal results were assayed using a 4-acid digest ICP AES (method OG-62).

FOR MORE INFORMATION PLEASE CONTACT:

Jason Mercier, VP Investor Relations and Communications
jason@panglobalresources.com / investors@panglobalresources.com
Tel: +1-236-886-9518
www.panglobalresources.com

Forward-looking statements

Statements which are not purely historical are forward-looking statements, including any statements regarding beliefs, plans, expectations, or intentions regarding the future. It is important to note that actual outcomes and the Company’s actual results could differ materially from those in such forward-looking statements. The Company believes that the expectations reflected in the forward-looking information included in this media release are reasonable, but no assurance can be given that these expectations will prove to be correct and such forward-looking information should not be unduly relied upon. Risks and uncertainties include, but are not limited to, economic, competitive, governmental, environmental, and technological factors that may affect the Company’s operations, markets, products, and prices. Readers should refer to the risk disclosures outlined in the Company’s Management Discussion and Analysis of its audited financial statements filed with the British Columbia Securities Commission.

The forward-looking information contained in this media release is based on information available to the Company as of the date of this media release. Except as required under applicable securities legislation, the Company does not intend, and does not assume any obligation, to update this forward-looking information.

NEITHER TSX VENTURE EXCHANGE NOR ITS REGULATION SERVICES PROVIDER (AS THAT TERM IS DEFINED IN THE POLICIES OF THE TSX VENTURE EXCHANGE) ACCEPTS RESPONSIBILITY FOR THE ADEQUACY OR ACCURACY OF THIS RELEASE.

Photos accompanying this announcement are available at: 

https://www.globenewswire.com/NewsRoom/AttachmentNg/1e63bbe6-0460-4105-b6a3-7322d28861cb

https://www.globenewswire.com/NewsRoom/AttachmentNg/0656c128-bdb3-4d64-ad4e-b884ff24494a

Lassila & Tikanoja Plc
Stock exchange release
17 September 2026 at 2.15 PM EEST

Composition of Lassila & Tikanoja Plc’s Nomination Board

Lassila & Tikanoja Plc’s three largest shareholders, who are determined on the basis of the shareholder register held by Euroclear as per 1 September 2026 and who are shareholders acting according to the principles otherwise mentioned in the Charter, are entitled to appoint their representatives to the company’s Nomination Board.

According to the Charter of the Nomination Board, a group of shareholders may agree on the appointment of a joint representative to the Nomination Board. The following two groups of shareholders have agreed on the appointment of a joint representative: Evald and Hilda Nissi Foundation and Bergholm Heikki as the first group and Chemec Oy, CH-Polymers Oy, Maijala Eeva, Maijala Investment Oy, Maijala Juhani, Maijala Juuso, Maijala Miikka, Maijala Mikko, Maijala Roope and Maijala Tuula as the second group.

Lassila & Tikanoja Plc’s three largest shareholders as per 1 September 2026, who are entitled to appoint a representative to Lassila & Tikanoja Plc’s Shareholders’ Nomination Board, are the above-mentioned groups of shareholders and Nordea Nordic Small Cap Fund.

The following persons have been appointed as their representatives in Lassila & Tikanoja’s Nomination Board:

  • Juhani Lassila – Chairman of the Board, Evald and Hilda Nissi Foundation, group of shareholders (approximately 11.5% of shares and votes)
  • Miikka Maijala – CEO, Clinius Oy, group of shareholders (approximately 9.4% of shares and votes)
  • Josefin Degerholm – CEO, Nordea Funds Ltd, Nordea Nordic Small Cap Fund (approximately 5.3% of shares and votes)

The Chairman of Lassila & Tikanoja Plc’s Board of Directors, Jukka Leinonen, acts as the fourth member of the Nomination Board. The Chairman of the Nomination Board is Juhani Lassila.
 
The Nomination Board prepares proposals for board members and board remuneration for the next Annual General Meeting.

LASSILA & TIKANOJA PLC

Joni Sorsanen
CFO

Additional information:
Joni Sorsanen, CFO, tel. +358 50 443 3045

Lassila & Tikanoja is a leading Nordic circular economy company committed to unleashing the potential of circularity together with its customers and partners. Our services include waste management and recycling, hazardous waste and remediation services as well as industrial services and water treatment. Our goal is to strengthen an efficient infrastructure in society and promote the sustainable use of materials by transforming waste streams into valuable raw materials. L&T employs approximately 2,300 people in Finland and Sweden and is listed on Nasdaq Helsinki.

Distribution:
Nasdaq Helsinki
Major media
www.lt.fi/en

Average annual production of 100 koz of gold over a 16.2-year mine life – After-tax NPV5% of C$1,565 M and after-tax IRR of 37.3% at spot gold of US$4,300/oz – NPV5% to initial capital ratio of 3.6x

Highlights

Robust Economics

  • After-tax NPV5% of C$1,001 M and after-tax IRR of 26.6% at a base case gold price of US$3,600/oz and an exchange rate of 1.38 C$/US$.
  • At a spot gold price of US$4,300/oz, after-tax NPV5% increases to C$1,565 M and after-tax IRR increases to 37.3%.
  • After-tax payback of 4.3 years and NPV5% to initial capital ratio of 3.6x.
  • Life-of-mine after-tax free cash flow of C$2,772 M over a 16.2-year mine life.
  • Initial CAPEX of C$275.8 M and AISC of US$2,137/oz.

Production and Operating Profile

  • Average annual gold production of 100koz over the life of mine.
  • Total recovered gold production of 1,610koz.
  • Metallurgical recovery of 95%, supported by the 2026 metallurgical testwork program and a conventional flowsheet with crushing, grinding, gravity concentration and cyanide leaching.
  • Processing scenario: 3,000 tpd toll milling (year 1), 3,000 tpd on-site processing (years 2-4), 4,300 tpd on-site processing following expansion (year 5+).
  • Mining scenario considers solely underground method of longitudinal longhole stoping with ramp extraction utilizing a peak mining rate of 4,300 tpd.

VAL-D’OR, Quebec, Sept. 17, 2026 (GLOBE NEWSWIRE) — Cartier Resources Inc. (″Cartier″ or the ″Company″) (TSXV: ECR; FSE: 6CA; OTCQB: ECRFF) is pleased to announce the results of the updated Preliminary Economic Assessment (″PEA″) on its 100%-owned Cadillac Project, located in Val-d’Or (Abitibi, Quebec, Canada). The updated PEA was prepared in accordance with National Instrument 43-101 – Standards of Disclosure for Mineral Projects (″NI 43-101″) by Evomine Consulting Inc., and replaces the PEA published on April 13, 2023, on what was then named the Chimo Mine Project. It incorporates the updated mineral resource estimate announced on December 18, 2025, the metallurgical results announced on May 14, 2026, and a materially different gold price environment.

Philippe Cloutier, President and CEO of Cartier, stated: “The positive results of the study demonstrate the project’s economic viability at the PEA level while highlighting several opportunities for further optimization. Importantly, the project has been designed as a fully underground mining operation, minimizing its surface footprint and supporting a responsible development approach. With low initial CAPEX requirements, we now have additional strategic solutions that offer flexibility to advance development. We remain confident in the project’s strong potential and our ability to create additional value for stakeholders,”

Ronan Déroff, Vice President Exploration of Cartier, added: “The current PEA is only the beginning. With ~35,000 metres of drilling completed in 2025–2026 yet to be incorporated, and compelling new gold discoveries emerging at the Contact and Hope Sectors, we believe Cadillac offers substantial resource-growth potential and significant exploration upside along the 15-km Cadillac Fault — all of which remains outside the current economic model.”

Financial analysis

The economic analysis was performed using a 5% discount rate, a base case gold price of US$3,600/oz and an exchange rate of 1.38 C$/US$. On a pre-tax basis, the project generates an NPV5% of C$1,679 M, an IRR of 35.5% and a payback period of 3.0 years. On an after-tax basis, the project generates an NPV5% of C$1,001 M, an IRR of 26.6% and a payback period of 4.3 years. A summary of project economics is presented in Table 1.

Table 1: Summary of project economics

Description Unit Value
Exchange rate CA$/US$ 1.38
Gold price US$/oz 3,600
Mineralized material mined kt 23,145
Mineralized material grade g/t 2.28
Mineralized material ounces koz 1,698
Recovery % 95%
Recovered gold oz 1,610
Mine life years 16.2
Discount rate % 5.0%
Operating costs    
Mining operating cost CA$/t proc. 95.1
Processing operating cost CA$/t proc. 29.8
Waste and water management operating cost CA$/t proc. 1.5
General and administration operating cost CA$/t proc. 10.1
Total operating costs CA$/t proc. 136.4
AISC    
Total operating costs US$/oz 1,450
Selling costs US$/oz 5
Royalty costs US$/oz 47
Cash costs US$/oz 1,502
Sustaining capital costs US$/oz 635
All-In Sustaining Costs US$/oz 2,137
Capital costs    
Initial capital costs CA$M 275.8
Growth capital costs CA$M 277.1
Sustaining capital costs CA$M 1,062.0
Closure capital costs CA$M 40.0
Economics    
Pre-tax Net Present Value CA$M 1,679.4
Pre-tax Internal Rate of Return % 35.5%
Pre-tax Payback Period years 3.0
After-tax Net Present Value CA$M 1,001.2
After-tax Internal Rate of Return % 26.6%
After-tax Payback Period years 4.3

Table 2, Table 3, and Table 3 highlight the after-tax impact of performing a sensitivity analysis on gold price, capital costs and operating costs.

Table 2: Gold price sensitivity

Gold Price (US$/Oz) NPV (M CA$) IRR (%) Payback Period
3,000 497.2 16.4% 6.2
3,600 (base case) 1,001.2 26.6% 4.3
4,200 1,485.8 35.9% 2.8
4,800 1,961.7 44.9% 2.2
5,400 2,429.8 53.5% 1.9
6,000 2,896.0 62.0% 1.7


Table 3: Capital cost sensitivity

Capital costs NPV (M CA$) IRR (%)

Payback Period

-20% 1,165 35.1% 2.8
-10% 1,083 30.5% 3.4
Base Case 1,001 26.6% 4.3
+10% 918 23.4% 4.7
+20% 833 20.5% 5.1


Table 4: Operating cost sensitivity

Operating costs NPV (M CA$) IRR (%)

Payback Period

-20% 1,230 31.1% 3.4
-10% 1,116 28.9% 3.7
Base Case 1,001 26.6% 4.3
+10% 883 24.3% 4.5
+20% 762 21.8% 4.8


Capital and operating cost estimates

Initial capital is estimated at C$275.8 M, growth capital costs are estimated at C$277.1 M and sustaining capital at C$1,102.0 M, as detailed in Table 5. Total operating costs over the life-of-mine is estimated at C$3,148.2 M representing C$136.4/tonne processed, as detailed in Table 6.

Table 5: Capital cost summary

Cost Area Initial Capital Costs
(M CA$)
Growth Capital
Costs (M CA$)
Sustaining Capital
Costs (M CA$)
Total Capital Costs
(M CA$)
Infrastructure 40.9 – 52.5 93.4
Electrical and communication 27.9 – 8.1 36.0
Waste and water management 9.2 – 58.7 68.0
Mine – underground 91.3 – 720.2 811.5
Process plant 9.0 230.2 – 239.2
Indirect costs 29.8 9.0 84.0 122.7
Contingency 37.9 37.8 138.5 214.2
Capitalized revenue -30.2 – – -30.2
Capitalized operating costs 60.0 – – 60.0
Closure – – 40.0 40.0
Total 275.8 277.1 1,102.0 1,654.9


Table 6: Operating cost summary

Cost Area Total (M CA$) Unit cost (CA$/tonne processed) Unit cost (US$/oz payable)
Underground mining 2,193.7 95.1 1,010.3
Mineralized material transportation 15.1 0.7 6.9
Processing 672.3 29.1 309.6
Waste and water management 34.6 1.5 15.9
General and administrative 232.5 10.1 107.1
Total 3,148.2 136.4 1,449.9


Mine design and production schedule

The PEA presents an underground mining operation that uses conventional longitudinal longhole stoping at a peak mining rate of 4,300 tpd over a 16.2-year mine life. A total of 23.1 Mt of mineralized material at an average grade of 2.3 g/t representing 1,698 koz of gold will be extracted. The mineralized material will be loaded by load-haul-dump (LHD) machines and hauled to the surface by trucks via ramps. For backfilling, a combination of pastefill, cemented rockfill and dry rockfill will be used. The mine will be split into five separate areas with each area having their dedicated mining infrastructure as illustrated in Figure 1.

Figure 1: Mine design
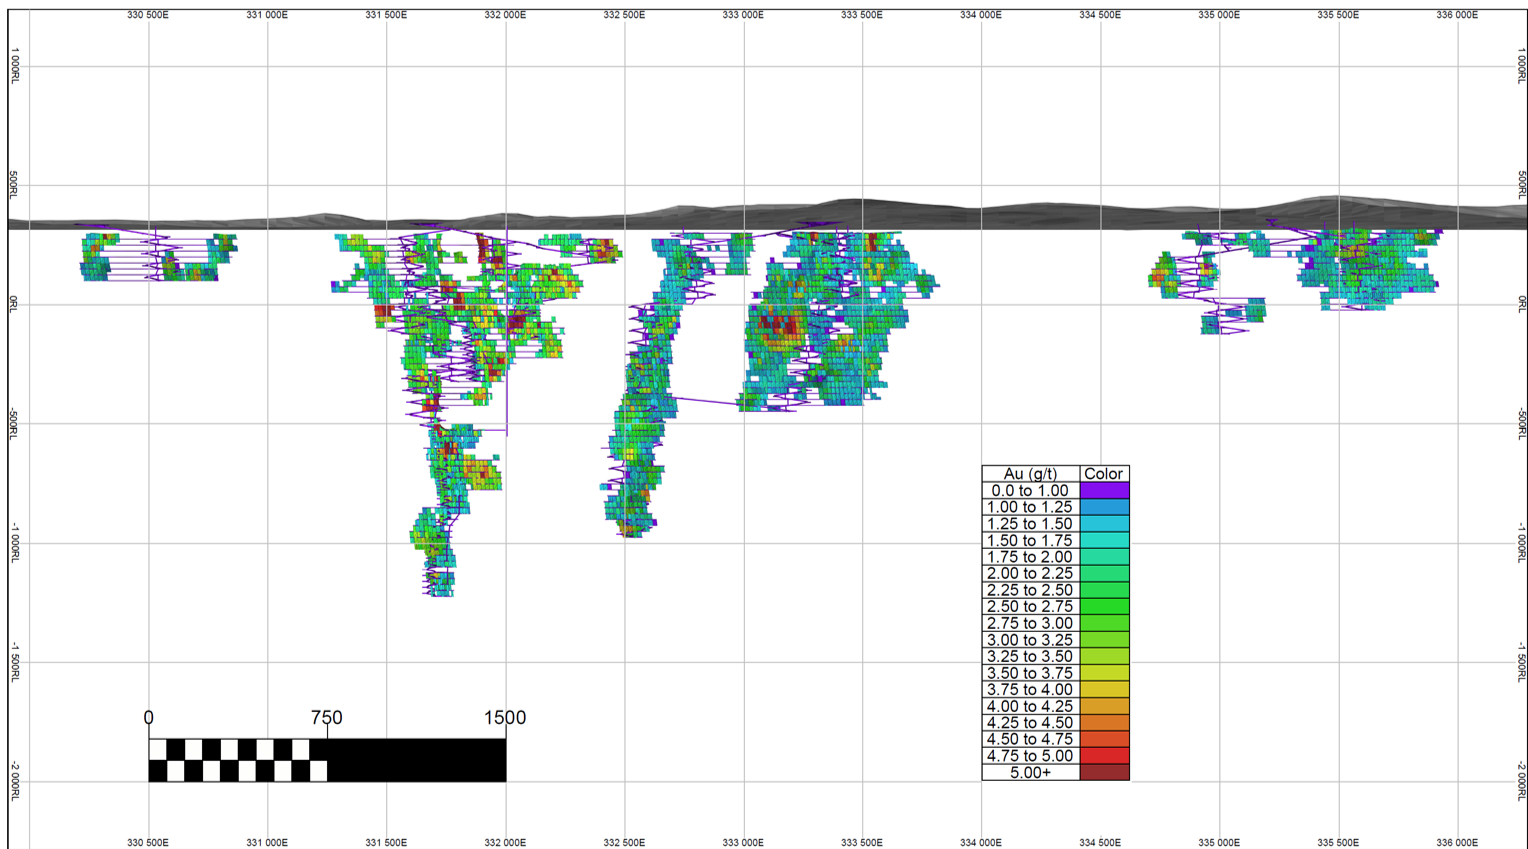
Mine design


Metallurgy and processing

To complete the process plant design and determine metallurgical performance, a series of tests were performed on six variability samples: two from each of the three main zones, Chimo, East Chimo, and West Nordeau. The samples were selected from exploration drill core and are considered representative of the mineral resources. The test program included mineralogy, geochemistry, grindability, gold recovery, and tailings detoxification. The results indicate that, based on the average resource grade, a gold recovery of 95% could be achieved at a grind size P80 of 50 µm. The tests also established the required grinding energy, gold recovery equipment criteria, and reagent dosage design criteria.

The processing strategy considers toll milling to an off-site process plant for the pre-production period and the first year of production at a rate of 3,000 tpd. An on-site, 3,000 tpd process plant will become available to process material as of the second year of production and until the fourth year of production when it will be expanded to 4,300 tpd for the remainder of the life-of-mine. Figure 2 below shows the process flowsheet and identifies the additional equipment required for the expansion in red.

Figure 2: Process flowchart
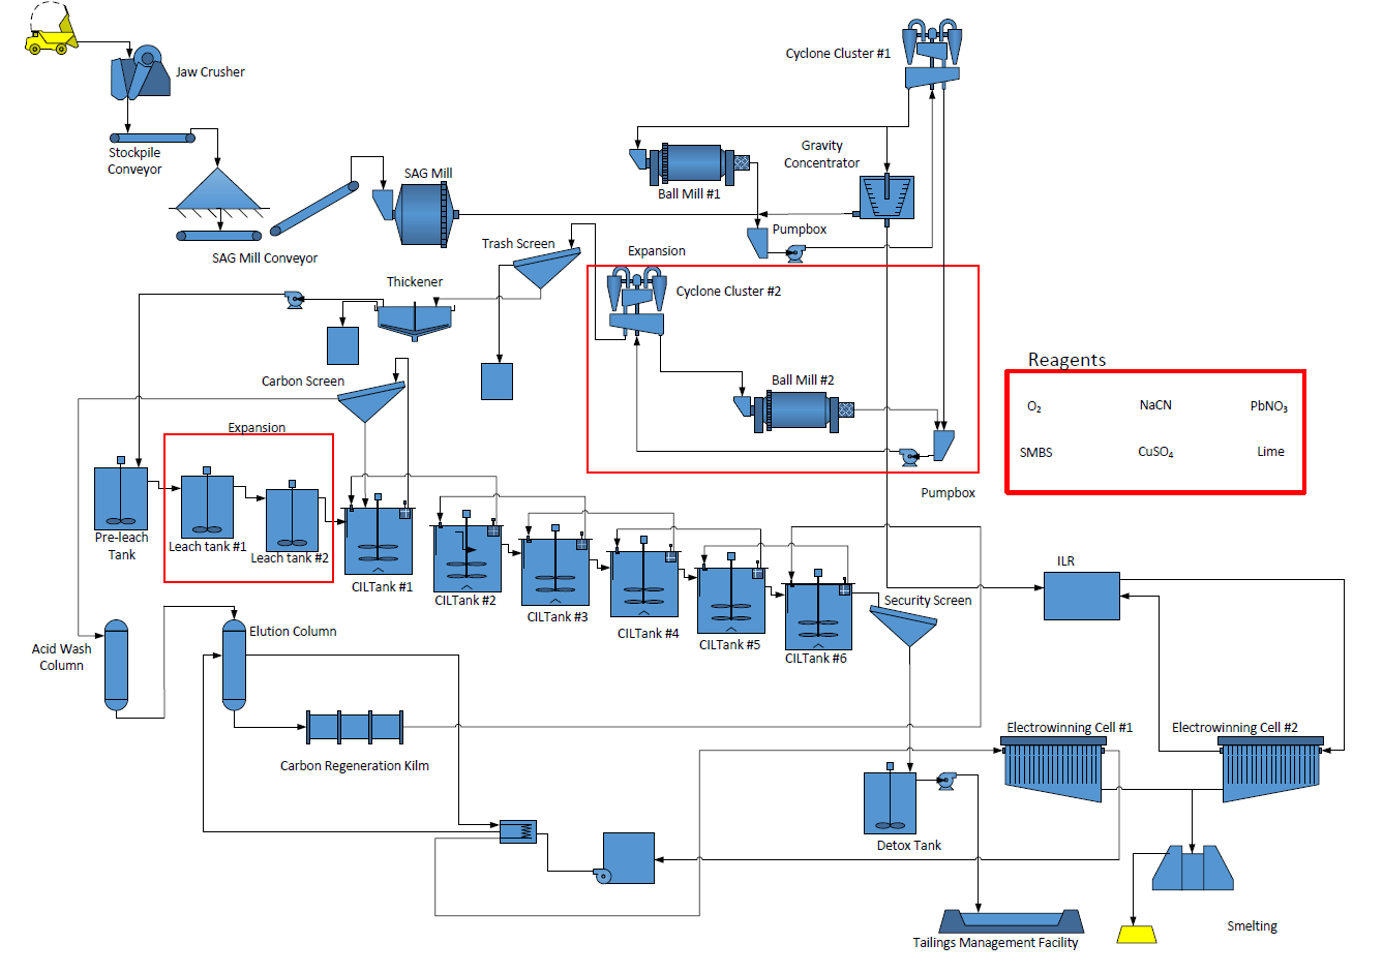
Process flowchart

All Phase 1 equipment will be designed to handle the life-of-mine throughput, while the added equipment will provide the additional grinding power and cyanidation residence time required to complete gold dissolution.

Based on this flowsheet and feed throughput, the capital and operating costs of the gold extraction process plant were estimated to support the economic analysis. The plant was designed to achieve the projected 95% gold recovery in both phases.

Supporting infrastructure

Infrastructure requirements to support the project have been evaluated and the overall site layout has been developed to optimize operational efficiency, safety, and environmental management, while accounting for topography and minimizing the surface impact in the Project area. The required infrastructure for the project includes the following:

  • Underground mine portals, lateral development and vertical development
  • Waste rock and overburden management facilities
  • Tailing management facility
  • ROM stockpiles
  • Water management infrastructure
  • Electrical powerlines and substations
  • Mine offices, dry and maintenance facility
  • Other supporting infrastructure

Figure 3 and Figure 4 illustrate the surface infrastructure general arrangement and the infrastructure on the main industrial pad for the project.

Figure 3: Surface infrastructure general arrangement
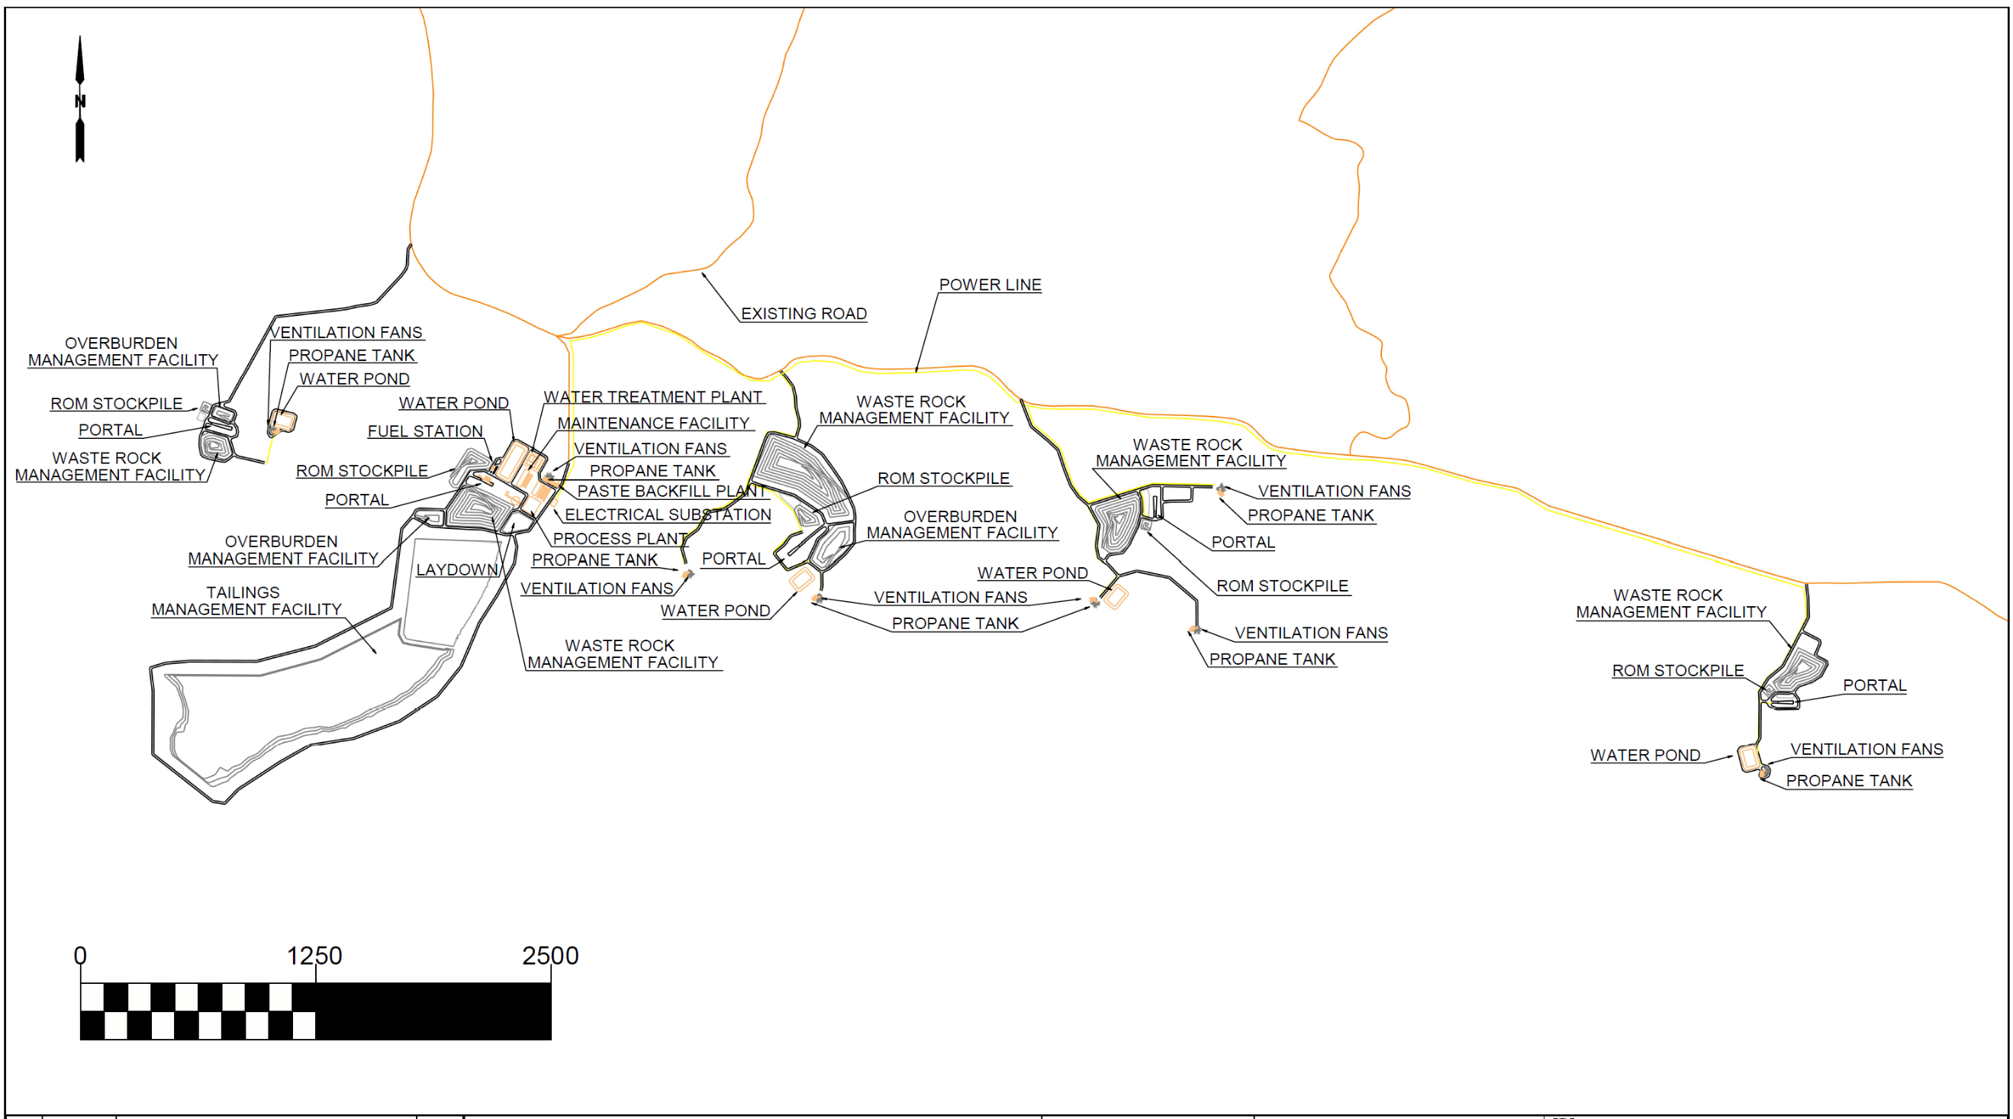
Surface infrastructure general arrangement

Figure 4: Main industrial pad infrastructure
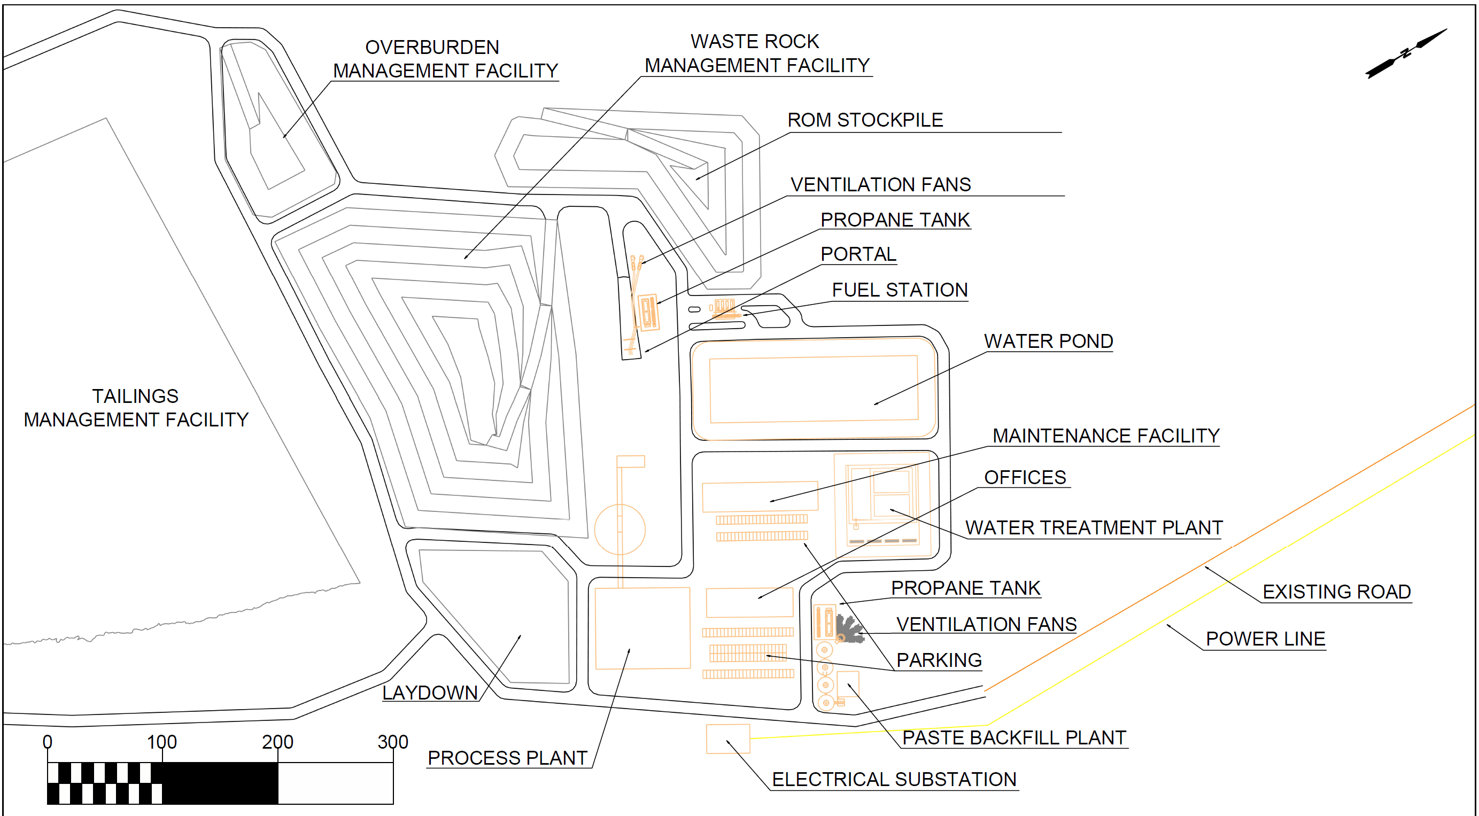
Main industrial pad infrastructure

Environmental, permitting and social considerations

The development of the Cadillac project continues under an approach focused on sustainable development, respect for stakeholders, and environmental protection. In 2026, Stantec completed a literature review of the project’s physical, biological, and social components in order to document and characterize the potential environmental issues associated with its footprint. The results of this review contributed to the selection and location of the infrastructure presented in the updated PEA, and will also be used to plan the next steps, including field inventories. In addition, an environmental geochemical characterization of the waste rock, ore, and tailings generated during processing was initiated in August 2026. This study is essential to the development of the Cadillac project, as it will help optimize the management of these materials and mining water management in order to limit impacts on the receiving environment. It will be conducted in accordance with the guidelines of Directive 019 and the Guide de caractérisation des résidus miniers et du minerai (GCRMM) issued by the Ministère de l’Environnement, de la Lutte contre les changements climatiques, de la Faune et des Parcs (MELCCFP).

Mineral Resource Estimate

The updated PEA is based on the mineral resource estimate announced on December 18, 2025, and detailed in the technical report filed on January 27, 2026 which is summarized in Table 7.

Table 7: Mineral Resource Estimate

All sectors /
Category

Open Pit Resources Underground Resources Total
Cut-off Grade = 0.30g/t Au Cut-off Grade = 1.00g/t Au
Tonnes (t) Grade
(Au g/t)
Gold (oz) Tonnes (t) Grade
(Au g/t)
Gold (oz) Tonnes (t) Grade
(Au g/t)
Gold (oz)
Measured 1,770,000 2.16 123,300 4,210,000 2.80 379,300 5,988,000 2.61 502,600
Indicated 1,730,000 1.52 84,500 2,240,000 2.51 180,600 3,965,000 2.08 265,200
Measured &
Indicated
3,500,000 1.84 207,800 6,450,000 2.70 559,900 9,953,000 2.40 767,800
Inferred 4,740,000 1.13 172,600 30,450,000 2.29 2,244,200 35,185,000 2.14 2,416,900
  1. The independent qualified persons for the MRE, as defined by National Instrument (“NI”) 43-101 guidelines, is Pierre Luc Richard, P.Geo., of PLR Resources Inc., with contributions from Stephen Coates, P.Eng., of Evomine Consulting for cut-off grade estimation and open pit and underground stope optimization solids.
  2. These Mineral Resources are not mineral reserves as they have no demonstrated economic viability. No economic evaluation of these Mineral Resource has been produced. The quantity and grade of reported Inferred Resources in this MRE are uncertain in nature and there has been insufficient drilling to define these Inferred Resources as Indicated. However, it is reasonably expected that the majority of Inferred Mineral Resources could be upgraded to Indicated category with continued drilling.
  3. The Qualified Persons are not aware of any known environmental, permitting, legal, title-related, taxation, socio-political, marketing or other relevant issues that could materially affect the Mineral Resource Estimate.
  4. Calculations used metric units (metres, tonnes). Metal contents in the above table are presented in gram per tonne and troy ounces. Metric tonnages and ounces were rounded, and any discrepancies in total amounts are due to rounding errors.
  5. CIM definitions and guidelines for Mineral Resource Estimates have been followed.

Notes Accompanying the Mineral Resource Estimate

  • Resources are presented as undiluted and in situ for the open-pit scenario within 5m x 5m x 5m blocks and include internal dilution for the underground scenario and are considered to have reasonable prospects for economic extraction. The constraining pit shell was developed using overall pit slopes of 50 degrees. The pit optimization to develop the mineral resource-constraining pit shells was done using the pseudoflow algorithm in Deswik software. The stope optimization to develop the underground mineral resource was done using Deswik.SO software.
  • The MRE wireframe was prepared using Leapfrog Edge v.2025.1.1 and is based on 4,477 drill holes, totalling 535,360 meters drilled and 167,978 assays. The cut-off date for the drill hole database was February 17, 2025.
  • Composites of 1.0 metre were created inside the mineralization domains. High-grade capping was done on the composited assay data. Based on individual statistical study for each zone, composites were capped between 5.0 g/t Au and 110.0 g/t Au for the high-grade zones, and between 1.0 g/t Au and 5.0 g/t Au for the low-grade zones.
  • Pit constrained Mineral Resources for the base case are reported at a cut-off grade of 0.30 g/t Au; DSO-constrained Mineral Resources for the base case are reported at a cut-off grade of 1.00 g/t Au and include internal dilution (must-take). The cut-off grades will be re-evaluated in light of future prevailing market conditions and costs.
  • Specific gravity values were estimated using data available in the drill hole database. Density values between 2.80 and 2.88 were applied to the model for hard rock and 2.00 for overburden.
  • Grade model resource estimation was calculated from drill hole data using an Ordinary Kriging interpolation method in a sub-blocked model using blocks measuring 5 m x 5 m x 5 m in size and sub-blocks down to 0.625m x 0.625m x 0.625m. Ordinary kriging (OK), inverse square distance (ID2), Nearest neighbour (NN) interpolation methods were tested, resulting in no material difference in the Mineral Resource Estimates.
  • The Measured, Indicated and Inferred Mineral Resource categories are constrained to areas where drill spacing is less than 12.5m, 25m and 100 metres respectively and show reasonable geological and grade continuity. An additional requirement for the Measured category is the close proximity of underground infrastructure. Cookie cutters were used to define categories based on the above parameters. Based on historical mining and geological knowledge of the deposit, drill spacing was increased up to 140m in the shoot direction to define inferred resources for some zones.

Independence and Responsibilities

The updated PEA was prepared by independent consulting firms with the respective responsibilities set out in Table 8.

Table 8: Consulting Firms and Areas of Responsibility

Consulting firm Area of responsibility
Evomine Consulting Inc.
Lead consultant and integrator
  • Study management and integration
  • Mine design and production schedule
  • Supporting infrastructure
  • Capital and operating cost estimates
  • Financial analysis
Geodoz Conseil Inc.
  • Environmental, permitting and social considerations
  • Closure cost estimates
PLR Resources Inc.
  • Mineral resource estimate
Soutex Inc.
  • Metallurgy and processing
  • Process capital and operating cost estimates


Qualified Person

The PEA was prepared by consultants who are independent of Cartier, each of whom are Qualified Persons (″QP″) as defined by NI 43-101 as defined by National Instrument 43-101 – Standards of Disclosure for Mineral Projects (″NI 43-101″). Each of the QPs have reviewed and confirmed that this news release fairly and accurately reflects, in the form and context in which it appears, the information contained in the respective sections of the PEA for which they are responsible. The following acted as QPs under NI 43-101 in the context of the PEA:

  • Alexandre Burelle, P.Eng. of Evomine Consulting Inc. responsible for Mining Methods, Project Infrastructure, Economic Analysis, and inputs for Capital and Operating Costs.
  • Stephen Coates, P.Eng. of Evomine Consulting Inc. responsible for Introduction, Reliance on Other Experts, Market Studies and Contracts, and Other Relevant Data and Information.
  • Maude Lévesque Michaud, P.Eng, M.Sc.A. of Geodoz Conseil Inc. responsible for Environmental Studies, Permitting and Social or Community Impact and inputs for Capital and Operating Costs.
  • Pierre-Luc Richard, P.Geo. of PLR Resources Inc. responsible for Property Description and Location, Accessibility, Climate, Local Resources, Infrastructure and Physiography, History, Geological Setting and Mineralization, Deposit Types, Exploration, Drilling, Sample Preparation, Analyses and Security, Data Verification, Mineral Resource Estimates, and Adjacent Properties.
  • Pierre Roy, P.Eng., M.Sc., of Soutex Inc. responsible for Mineral Processing, and Metallurgical Testing, Recovery Methods and inputs for Capital and Operating Costs.
  • The scientific and technical content of this press release has been reviewed and approved by Mr. Ronan Déroff, P.Geo., M.Sc., Vice President Exploration of Cartier, who is a QP under NI 43-101.

Technical Report Filing

A technical report prepared in accordance with NI 43-101 in support of the updated PEA will be filed on SEDAR+ at www.sedarplus.ca and on the Company’s website within 45 days of the date of this news release.

About Cadillac Project

The Cadillac Project, covering 14,000 hectares along a 15-kilometre stretch of the Cadillac Fault, is one of the largest consolidated land packages in the Val-d’Or mining camp. Cartier’s flagship asset integrates the historic Chimo Mine and East Cadillac projects, creating a dominant position in a world-class gold mining district. With excellent road access, year-round infrastructure and nearby milling capacity, the project is well positioned for rapid advancement and value creation. The Cadillac property contains total gold resources of 767,800 ounces in the measured and indicated category (10.0 Mt at 2.4 g/t Au) and 2,416,900 ounces in the inferred category (35.2 Mt at 2.1 g/t Au) across all sectors. An updated PEA for the Cadillac Project demonstrated an after-tax NPV5% of C$1,001 M and IRR of 26.6% at US$3,600/oz Gold.

About Cartier Resources Inc.

Cartier Resources Inc., founded in 2006 and headquartered in Val-d’Or (Quebec) is a gold exploration company focused on building shareholder value through discovery and development in one of Canada’s most prolific mining camps. The Company combines strong technical expertise, a track record of successful exploration, and a fully funded program to advance its flagship Cadillac Project. Cartier’s strategy is clear: unlock the full potential of one of the largest undeveloped gold landholdings in Quebec.

Non-IFRS Financial Measures

This news release includes certain performance measures commonly used in the mining industry that are not defined under IFRS. These measures have no standardized meaning under IFRS and may not be comparable to similar measures used by other companies. They are provided for additional information only and should not be considered in isolation or as a substitute for IFRS measures. As the project is at the PEA stage and not in production, no historical reconciliations to IFRS measures are available.

Forward-Looking Statements

This news release contains ″forward-looking information″ and ″forward-looking statements″ within the meaning of applicable Canadian securities legislation. Forward-looking statements include, but are not limited to, statements regarding the results and assumptions of the updated PEA, projected production, capital and operating costs, net present value, internal rate of return and payback period, the timing and filing of the technical report, the timing and results of future exploration, resource conversion, permitting and development activities, and the Company’s plans and objectives. Forward-looking statements are based on assumptions that management considers reasonable, including assumptions as to gold prices, exchange rates, metallurgical recoveries, the availability of third-party milling capacity, capital and operating cost estimates, the accuracy of mineral resource estimates, the ability to obtain required permits and financing, and the absence of material adverse changes in the economic and regulatory environment. Actual results may differ materially. The PEA is preliminary in nature and includes Inferred Mineral Resources that are considered too speculative geologically to have the economic considerations applied to them that would enable them to be categorized as Mineral Reserves, and there is no certainty that the results of the PEA will be realized. Risks and uncertainties include, but are not limited to, fluctuations in the price of gold and in exchange rates, the inability to convert mineral resources into mineral reserves, the preliminary nature of metallurgical results, variations in capital and operating costs from estimates, delays in obtaining permits or third-party agreements, changes in the availability and cost of financing, the duty to consult and accommodate First Nations, and the other risk factors described in the Company’s continuous disclosure documents filed on SEDAR+ at www.sedarplus.ca. Readers should not place undue reliance on forward-looking statements, which speak only as of the date of this news release. The Company disclaims any obligation to update forward-looking information except as required by law.

For further information, contact:
Philippe Cloutier, P. Geo.
President and CEO
Telephone: 819-856-0512
philippe.cloutier@ressourcescartier.com
www.ressourcescartier.com

Neither TSX Venture Exchange nor its Regulation Services Provider (as that term is defined in policies of the TSX Venture Exchange) accepts responsibility for the adequacy or accuracy of this release.

Photos accompanying this announcement are available at
https://www.globenewswire.com/NewsRoom/AttachmentNg/58418ab4-a237-4a57-8ca4-84bdb8b464b3
https://www.globenewswire.com/NewsRoom/AttachmentNg/0bfe1fa0-9202-4095-b09c-a7da75c365eb
https://www.globenewswire.com/NewsRoom/AttachmentNg/53b5cc9e-07f7-41ea-826a-2b115be72327
https://www.globenewswire.com/NewsRoom/AttachmentNg/a2f7db64-bd52-47f8-a45e-fa4b1e68a673

FORESIGHT TECHNOLOGY VCT plc

LEI: 21380013CXOR8N6OD977

17 SEPTEMBER 2026

NAV ANNOUNCEMENT

The Board of Foresight Technology VCT plc announces that the unaudited Net Asset Value for the FWT share class as at 30 June 2026 was 88.4p per share.

For further information, please contact:

Company Secretary
Foresight Group LLP
Contact: Stephen Thayer Tel: 0203 667 8100

Investor Relations
Foresight Group LLP
Contact: Andrew James Tel: 0203 667 8181

Realkredit Danmark will open new mortgage-coverd bonds (SDRO’s).

The new mortgage-covered bonds will be admitted to trading on Nasdaq Copenhagen.

The new mortgage-covered bonds are covered by the “Base prospectus for mortgage-covered bonds and mortgage bonds issued by Realkredit Danmark A/S.”

The base prospectus is available on Realkredit Danmark’s website at www.rd.dk/Investor.

The final terms are hereby published.

Please contact Hella Gebhardt Rønnebæk on tel. +45 45 13 20 68 if you have any questions.

Attachments

BETHESDA, Md., Sept. 17, 2026 (GLOBE NEWSWIRE) — Gain Therapeutics, Inc. (Nasdaq: GANX) (“Gain” or the “Company”), a clinical-stage biotechnology company leading the discovery and development of the next generation of allosteric small molecule therapies, today announced that Gene Mack, President and CEO, will participate in an industry panel and one-on-one meetings at the ROTH Fifth Annual Healthcare Opportunities Conference, held September 29th at the Metropolitan Club in New York, NY.

Presentation Information

Presentation Title: Frontiers in Neuroscience

Date: Tuesday, September 29, 2026

Time: 11:00 a.m. ET

Registered attendees can request one-on-one meetings with Gain management via their ROTH sales representative.

If you are unable to attend the conference and would like to schedule a meeting with Gain management, please contact ir@gaintherapeutics.com.

About Gain Therapeutics, Inc.
Gain Therapeutics, Inc. is a clinical-stage biotechnology company leading the discovery and development of next-generation allosteric therapies. Gain’s lead drug candidate, rexaceract, is currently being evaluated for the treatment of Parkinson’s disease with or without a GBA1 mutation in a Phase 1b clinical trial. Rexaceract has further potential in Gaucher’s disease, dementia with Lewy bodies, and Alzheimer’s disease. Gain has multiple undisclosed preclinical assets targeting lysosomal storage disorders, metabolic diseases, and solid tumors.

Gain’s unique approach enables the discovery of novel allosteric small molecule modulators that can restore or disrupt protein function. Deploying its highly advanced Magellan™ platform, Gain is accelerating drug discovery and unlocking novel disease-modifying treatments for untreatable or difficult-to-treat disorders including neurodegenerative diseases, rare genetic disorders and oncology.

Forward-Looking Statements
This release contains “forward-looking statements” made pursuant to the safe harbor provisions of the Private Securities Litigation Reform Act of 1995. These statements are typically preceded by words such as “believes,” “expects,” “anticipates,” “intends,” “will,” “may,” “should,” or similar expressions. These forward-looking statements reflect management’s current knowledge, assumptions, judgment and expectations regarding future performance or events. Although management believes that the expectations reflected in such statements are reasonable, they give no assurance that such expectations will prove to be correct or that those goals will be achieved, and you should be aware that actual results could differ materially from those contained in the forward-looking statements. Forward-looking statements are subject to a number of risks and uncertainties, including, but not limited to, statements regarding: the development of the Company’s current or future product candidates; expectations regarding the timing of patient enrollment and the completion and timing of results from a Phase 1b clinical study for rexaceract, including any extension studies; the timing of any submissions to the FDA or other regulatory bodies and agencies; the timing of the commencement of the Phase 2 clinical study for rexaceract; the ability for the Company to enroll patients in its planned Phase 2 clinical study for rexaceract; the Company’s ability to replicate positive results from earlier preclinical studies or clinical trials in current or future clinical trials; the Company’s business development activities, strategic collaborations, licensing opportunities and financing activities; the advancement, prioritization and timing of the Company’s pipeline programs, including GT-04686; and the potential therapeutic and clinical benefits of the Company’s product candidates. For a further description of the risks and uncertainties that could cause actual results to differ from those expressed in these forward-looking statements, as well as risks relating to the Company’s business in general, please refer to the Company’s Form 10-K for the year ended December 31, 2025 and other filings made with the SEC. All forward-looking statements are expressly qualified in their entirety by this cautionary notice. You are cautioned not to place undue reliance on any forward-looking statements, which speak only as of the date of this release. We have no obligation, and expressly disclaim any obligation, to update, revise or correct any of the forward-looking statements, whether because of new information, future events or otherwise.

Investors:
Gain Therapeutics, Inc. 
Apaar Jammu 
Director, Investor Relations and Public Relations
ajammu@gaintherapeutics.com

LifeSci Advisors LLC
Chuck Padala
Managing Director
chuck@lifesciadvisors.com

Media:
Russo Partners LLC
Nic Johnson and Elio Ambrosio
nic.johnson@russopartnersllc.com
elio.ambrosio@russopartnersllc.com
(760) 846-9256

Privacy Overview

This website uses cookies so that we can provide you with the best user experience possible. Cookie information is stored in your browser and performs functions such as recognising you when you return to our website and helping our team to understand which sections of the website you find most interesting and useful.