SOUTHAMPTON, Pa., Sept. 10, 2026 (GLOBE NEWSWIRE) — Environmental Tectonics Corporation (OTCID: ETCC) (“ETC” or the “Company”) today announced that it has completed the sale of 100% of the equity interests of its wholly owned Polish subsidiary, ETC-PZL Aerospace Industries sp.z o.o. (“ETC-PZL) to Fabryka Artykułów Turystycznych i Sportowych Polsport sp. z o.o., a limited liability company incorporated under the laws of the Republic of Poland.

The transaction is part of the Company’s ongoing efforts to focus its resources on its core businesses and strategically align its operations with its long term objectives. The Company expects the transaction to have a positive impact on its ongoing consolidated financial results.

ETC and ETC-PZL entered into a separate 10-year Cooperation Agreement under which ETC-PZL will serve as a preferred supplier to the Company for certain products manufactured by ETC-PZL. Under the agreement, the Company retains the ability to manufacture the applicable products internally if the parties are unable to reach mutually acceptable commercial terms, if ETC-PZL is unable to meet the Company’s supply requirements or if ETC-PZL is unable to supply based on certain applicable regulatory requirements.

Robert L. Laurent, Jr., ETC’s Chief Executive Officer and President stated, “I look forward to continuing the longstanding strategic partnership with ETC-PZL. This transaction provides ETC a meaningful opportunity to improve operating results while maintaining continuity of supply and the flexibility to manufacture products internally.”

About ETC

ETC designs, manufactures, and sells software-driven products and services used to recreate and monitor the physiological effects of motion on humans, and equipment to control, modify, simulate and measure environmental conditions. Our products include aircrew training systems (aeromedical, tactical combat, and general), disaster management systems, sterilizers (steam and gas), environmental testing and simulation systems, and other products that involve similar manufacturing techniques and engineering technologies. ETC’s unique ability to offer complete systems, designed and produced to high technical standards, sets it apart from its competition. ETC’s headquarters is in Southampton, PA. For more information about ETC, visit http://www.etcusa.com/.

Forward-looking Statements
This news release contains forward-looking statements, which are based on management’s expectations and are subject to uncertainties and changes in circumstances. Words and expressions reflecting something other than historical fact are intended to identify forward-looking statements, and these statements may include terminology such as “may”, “will”, “should”, “expect”, “plan”, “anticipate”, “believe”, “estimate”, “future”, “predict”, “potential”, “intend”, or “continue”, and similar expressions. We base our forward-looking statements on our current expectations and projections about future events or future financial performance. Our forward-looking statements are subject to known and unknown risks, uncertainties and assumptions about ETC and its subsidiaries that may cause actual results to be materially different from any future results implied by these forward-looking statements. We caution you not to place undue reliance on these forward-looking statements. 

CONTACT: Contact: Tim Kennedy, CFO
Phone: (215) 355-9100 
E-mail: info@etcusa.com 

ATHENS, Greece, Sept. 10, 2026 (GLOBE NEWSWIRE) — IMPERIAL PETROLEUM INC. (NASDAQ: IMPP; the “Company”), a ship-owning company providing petroleum products, crude oil and dry bulk seaborne transportation services, announced today its unaudited financial and operating results for the second quarter and six months ended June 30, 2026.

OPERATIONAL AND FINANCIAL HIGHLIGHTS

  • Fleet operational utilization of 73.5% in Q2 26’.
  • Approximately 50% of total fleet calendar days in Q2 26’ were dedicated to time charter activity while approximately 39% were dedicated to spot activity.
  • Delivery of the dry bulk carrier, Eco Crossfire (2012 built), on April 3, 2026 and delivery of the drybulk carrier, Outrider (2016 built), on August 21, 2026.
  • Sale of our tanker Suez Enchanted (2007 built) to third parties, on August 7, 2026, creating a net gain on sale of approximately $32 million.
  • All-time high quarterly revenues of $87.1 million in Q2 26’ compared to $61.7 million in Q1 26’ and $36.3 million in Q2 25’, representing a 41.2% increase and a 139.9% increase, respectively.
  • Near all-time high operating income of $33.4 million in Q2 26’ marking a $6.9 million or 26.0% increase compared to Q1 26’ and a $25.2 million or 307.3% increase compared to Q2 25’.
  • Net income of $34.8 million in Q2 26’- the second best in our history- compared to $28.0 million in Q1 26’, and $12.8 million in Q2 25’, representing a 24.3% and 171.9% increase, respectively.
  • Basic EPS of $0.75 in Q2 26’ and $1.34 for 6M 2026.
  • EBITDA1 of $41.2 million for Q2 26’.
  • Continued enhancement of our liquidity through efficient vessel operations; cash and cash equivalents including time deposits of $245.2 million as of June 30, 2026 compared to $179.1 million as of December 31, 2025 – corresponding to an increase of 36.9%. Our current cash base is about $260 million.
  • For the 6M’ 2026 our Net Income came in at $62.8 million, already exceeding our 12M’ 2025 net income  performance of $50.0 million.

Second Quarter 2026 Results: 

  • Revenues for the three months ended June 30, 2026, amounted to $87.1 million, an increase of $50.8 million or 139.9%, compared to revenues of $36.3 million for the three months ended June 30, 2025, primarily due to a 6.9 vessel increase in the average number of vessels in our fleet, along with an increase in both tanker and drybulk rates driven by geopolitical tensions, mostly affecting the tanker vessels, and favorable market dynamics in the drybulk market.
  • Voyage expenses and vessels’ operating expenses for the three months ended June 30, 2026, were $22.1 million and $14.4 million, respectively, compared to $10.7 million and $8.4 million, respectively, for the three months ended June 30, 2025. The $11.4 million increase in voyage expenses is mainly attributed to increased bunker costs by mainly due to an increase in spot days by 58.4% and increased bunkers’ prices. The $6.0 million increase in vessels’ operating expenses is primarily due to the increase of our fleet by an average of 6.9 vessels.
  • Drydocking costs for the three months ended June 30, 2026 and 2025 were $7.5 million and $1.7 million, respectively. During the three months ended June 30, 2026, six vessels underwent drydocking whereas during the three months ended June 30, 2025, one suezmax tanker and one supramax drybulk carrier underwent drydocking.
  • General and administrative costs for the three months ended June 30, 2026 and 2025, were $1.1 million in each period.
  • Depreciation for the three months ended June 30, 2026 and 2025, was $8.2 million and $5.7 million, respectively. The change is attributable to the increase in the average number of vessels in our fleet.
  • Management fees for the three months ended June 30, 2026 and 2025, were $0.8 million and $0.6 million, respectively. The change is attributable to the increase in the average number of vessels in our fleet.
  • Interest and finance costs for the three months ended June 30, 2026 and 2025, were $0.4 million and $0.8 million, respectively. The $0.4 million of costs for the three months ended June 30, 2026 related mainly to accrued interest expense – related party in connection with the $19.2 million and $12.3 million portions of the acquisition price of our bulk carriers, Post Marvel and Eco Crossfire, respectively, which were completely settled in the third quarter of 2026. The $0.8 million of costs for the three months ended June 30, 2025 related mainly to accrued interest expense – related party in connection with our last nine vessel acquisitions, for which the purchase agreements allowed vessel repayment to take place within up to one year from the agreement date. For accounting purposes, the outstanding balances payable on the vessels were required to be allocated between principal and imputed interest, despite the fact that no interest was contractually charged by the sellers. The total amount ultimately paid remains consistent with the originally agreed purchase prices.
  • Interest income for the three months ended June 30, 2026, was $2.1 million as compared to $2.3 million for the three months ended June 30, 2025. The $0.2 million decrease is mainly attributed to a period on period decline in time deposit rates and amounts placed in time deposits.
  • Foreign exchange (loss)/gain for the three months ended June 30, 2026, was a loss of $0.6 million as compared to a gain of $3.0 million for the three months ended June 30, 2025. The $0.6 million foreign exchange loss for the three months ended June 30, 2026 is mainly attributed to the weakening of the Euro currency against the Dollar at the end of the three months ended June 30, 2026 when compared to the respective currency values prevailing at the end of March 2026.
  •  As a result of the above, for the three months ended June 30, 2026, the Company reported net income of $34.8 million, compared to net income of $12.8 million for the three months ended June 30, 2025. Dividends paid on Series A Preferred Shares amounted to $0.4 million for the three months ended June 30, 2026. The weighted average number of shares of common stock outstanding, basic, for the three months ended June 30, 2026 was 45.4 million. Earnings per share, basic and diluted, for the three months ended June 30, 2026 amounted to $0.75 and $0.70, respectively, compared to earnings per share, basic and diluted, of $0.36 and $0.35, respectively, for the three months ended June 30, 2025.
  •  Adjusted net income1 was $35.3 million corresponding to an Adjusted EPS1, basic of $0.76 for the three months ended June 30, 2026 compared to an Adjusted net income of $13.4 million, or an Adjusted EPS, basic, of $0.38 for the same period of last year.
  •  EBITDA1 for the three months ended June 30, 2026 amounted to $41.2 million, while Adjusted EBITDA1 for the three months ended June 30, 2026 amounted to $41.7 million.
  • An average of 21.0 vessels were owned by the Company during the three months ended June 30, 2026 compared to 14.1 vessels for the same period of 2025.

Six Months 2026 Results:

  • Revenues for the six months ended June 30, 2026 amounted to $148.8 million, an increase of $80.4 million or 117.5%, compared to revenues of $68.4 million for the six months ended June 30, 2025, primarily due to a 7.4 vessel increase in the average number of vessels in our fleet, along with an increase in tanker rates noticeable from the beginning of 2026 and drybulk rates which mostly improved in the second quarter of 2026.
  • Voyage expenses and vessels’ operating expenses for the six months ended June 30, 2026, were $34.9 million and $25.6 million, respectively, compared to $21.2 million and $15.5 million, respectively, for the six months ended June 30, 2025. The $13.7 million increase in voyage expenses is mainly attributed to an increase in spot days by 40.3%. The $10.1 million increase in vessels’ operating expenses is primarily due to the increase in the average number of vessels in our fleet by 7.4 vessels.
  • Drydocking costs for the six months ended June 30, 2026 and 2025, were $9.0 million and $1.7 million, respectively. During the six months ended June 30, 2026, seven vessels underwent drydocking whereas during the six months ended June 30, 2025, one suezmax tanker and one supramax drybulk carrier underwent drydocking.
  • General and administrative costs for the six months ended June 30, 2026 and 2025, were $2.2 million and $2.3 million, respectively. This decrease is mainly attributed to the decrease in stock-based compensation costs.
  • Depreciation for the six months ended June 30, 2026 was $16.1 million, a $5.4 million increase from $10.7 million for the same period of last year, due to the increase in the average number of our vessels.
  • Management fees for the six months ended June 30, 2026 and 2025, were $1.6 million and $1.0 million, respectively. The change is attributable to the increase in the average number of vessels in our fleet.
  • Interest and finance costs for the six months ended June 30, 2026 and 2025, were $0.6 million and $1.4 million, respectively. The $0.6 million of costs for the six months ended June 30, 2026 related mainly to accrued interest expense – related party in connection with the $19.2 million and $12.3 million portions of the acquisition prices of our bulk carriers, Post Marvel and Eco Crossfire, respectively, which were completely settled in the third quarter of 2026. The $1.4 million of costs for the six months ended June 30, 2025 related mainly to accrued interest expense – related party in connection with our last nine vessel acquisitions, for which the purchase agreements allowed vessel repayment to take place within up to one year from the agreement date. For accounting purposes, the outstanding balances payable on the vessels were required to be allocated between principal and imputed interest, despite the fact that no interest was contractually charged by the sellers. The total amount ultimately paid remains consistent with the originally agreed purchase prices.
  • Interest income for the six months ended June 30, 2026 and 2025, was $3.9 million and $4.5 million, respectively. The $0.6 million decrease is mainly attributed to a decline in time deposit rates and amounts placed in time deposits.
  • Foreign exchange (loss)/gain for the six months ended June 30, 2026 was a loss of $0.8 million as compared to a gain of $4.7 million for the six months ended June 30, 2025. The $0.8 million foreign exchange loss for the six months ended June 30, 2026 is mainly attributed to the weakening of the Euro currency against the US Dollar at the end of the six months ended June 30, 2026 when compared to the respective currency values prevailing at the end of the year 2025.
  • As a result of the above, the Company reported net income for the six months ended June 30, 2026 of $62.8 million, compared to a net income of $24.1 million for the six months ended June 30, 2025. The weighted average number of shares outstanding, basic, for the six months ended June 30, 2026 was 45.3 million. Earnings per share, basic and diluted, for the six months ended June 30, 2026 amounted to $1.34 and $1.27, respectively compared to earnings per share, basic and diluted, of $0.67 and $0.65 for the six months ended June 30, 2025.
  • Adjusted Net Income was $63.9 million corresponding to an Adjusted EPS, basic, of $1.37 for the six months ended June 30, 2026 compared to an Adjusted Net Income of $25.6 million, or an Adjusted EPS, basic, of $0.72, basic, for the same period of last year.
  • EBITDA for the six months ended June 30, 2026 amounted to $75.6 million while Adjusted EBITDA for the six months ended June 30, 2026 amounted to $76.7 million. Reconciliations of Adjusted Net Income, EBITDA and Adjusted EBITDA to Net Income are set forth below.
  • An average of 20.4 vessels were owned by the Company during the six months ended June 30, 2026 compared to 13.0 vessels for the same period of 2025.
  • As of June 30, 2026, cash and cash equivalents including time deposits amounted to $245.2 million and total debt amounted to nil.

1 EBITDA, Adjusted EBITDA, Adjusted Net Income and Adjusted EPS are non-GAAP measures. Refer to the reconciliation of these measures to the most directly comparable financial measure in accordance with GAAP set forth later in this release. Reconciliations of Adjusted Net Income, EBITDA and Adjusted EBITDA to Net Income are set forth below.

Fleet Employment Table

As of September 10, 2026, the profile and deployment of our fleet is the following:

Name Year Country Vessel Size Vessel Employment Expiration of
  Built Built (dwt) Type Status Charter (1)
Tankers            
Magic Wand 2008 Korea 47,000 MR product tanker Spot  
Clean Thrasher 2008 Korea 47,000 MR product tanker Spot  
Clean Sanctuary 2009 Korea 46,000 MR product tanker Time Charter September 26
Clean Nirvana 2008 Korea 50,000 MR product tanker Spot  
Clean Justice 2011 Japan 46,000 MR product tanker Time Charter September 27
Aquadisiac 2008 Korea 51,000 MR product tanker Spot  
Clean Imperial 2009 Korea 40,000 MR product tanker Spot  
Suez Protopia 2008 Korea 160,000 Suezmax tanker Spot  
Drybulk Carriers            
Eco Wildfire 2013 Japan 33,000 Handysize drybulk Time Charter October 26
Glorieuse 2012 Japan 38,000 Handysize drybulk Time Charter September 26
Neptulus 2012 Japan 33,000 Handysize drybulk Time Charter October 26
Supra Pasha 2012 Japan 56,000 Supramax drybulk Time Charter September 26
Supra Monarch 2011 Japan 56,000 Supramax drybulk Spot  
Supra Baron 2009 Japan 56,000 Supramax drybulk Time Charter September 26
Supra Sovereign 2012 Japan 56,000 Supramax drybulk Time Charter November 26
Supra Duke 2011 Japan 56,000 Supramax drybulk Spot  
Eco Sikousis 2008 Japan 82,000 Kamsarmax drybulk Time Charter September 26
Eco Czar 2009 Japan 82,000 Kamsarmax drybulk Time Charter October 26
Post Marvel 2013 Japan 96,000 Post Panamax Time Charter October 26
Eco Crossfire 2012 Japan 33,000 Handysize drybulk Time Charter September 26
Outrider 2016 Japan 33,000 Handysize drybulk Spot  
Fleet Total (2)     1,197,000 dwt      

(1)
(2)
Earliest date charters could expire.
We have agreements to acquire an additional three handysize drybulk carriers of 107,400 dwt aggregate capacity and a product tanker of 50,000 dwt capacity, with deliveries scheduled in 2026.


CEO
Harry Vafias Commented

Our exceptional second quarter and first half of 2026 demonstrate the power of our commercial strategy and disciplined execution. By securing record revenues of $87.1 million for Q2 26’, expanding our fleet toward a 25-vessel target while remaining debt free, we have driven net income for the first six months to a remarkable $62.8 million, already surpassing our profitability for the entirety of 2025. Backed by a solid balance sheet and with cash to date in the order of approximately $260 million and a fleet value anticipated to increase with our upcoming vessel additions, we are well equipped to navigate shifting geopolitical landscapes. Imperial Petroleum is in a prime position to produce strong results, while holding a flawless balance sheet and a track record of creating value through the Company’s growth and strategic asset management.

Conference Call details:

On September 10, 2026 at 10:00 am ET, the company’s management will host a conference call to discuss the results and the company’s operations and outlook.

Online Registration:

Conference call participants should pre-register using the link below to receive the dial-in numbers and a personal PIN, which are required to access the conference call.

https://register-conf.media-server.com/register/BIe85f8402e2104ed2803a92fc451f9847

Slides and audio webcast:
There will also be a live and then archived webcast of the conference call, through the IMPERIAL PETROLEUM INC. website (www.ImperialPetro.com). Participants to the live webcast should register on the website approximately 10 minutes prior to the start of the webcast.

About IMPERIAL PETROLEUM INC.

IMPERIAL PETROLEUM INC. is a ship-owning company providing petroleum products, crude oil and drybulk seaborne transportation services. The Company owns a total of twenty-one vessels on the water – seven M.R. product tankers, one suezmax tanker, five handysize drybulk carriers, five supramax drybulk carriers, two kamsarmax drybulk vessels and a post panamax drybulk carrier – with a total capacity of approximately 1,197,000 deadweight tons (dwt) and has contracted to acquire an additional three handysize drybulk carriers and a product tanker of 157,400 dwt aggregate capacity. Following these deliveries, the Company’s fleet will count a total of 25 vessels with an aggregate capacity of about 1.3 million dwt. IMPERIAL PETROLEUM INC.’s shares of common stock and 8.75% Series A Cumulative Redeemable Perpetual Preferred Stock are listed on the Nasdaq Capital Market and trade under the symbols “IMPP” and “IMPPP,” respectively.

Forward-Looking Statements

Matters discussed in this release may constitute forward-looking statements. Forward-looking statements reflect our current views with respect to future events and financial performance and may include statements concerning plans, objectives, goals, strategies, future events or performance, including our intentions relating to fleet growth and financing, and outlook for our shipping sectors and vessel earnings, and underlying assumptions and other statements, which are other than statements of historical facts. The forward-looking statements in this release are based upon various assumptions, many of which are based, in turn, upon further assumptions, including without limitation, management’s examination of historical operating trends, data contained in our records and other data available from third parties. Although IMPERIAL PETROLEUM INC. believes that these assumptions were reasonable when made, because these assumptions are inherently subject to significant uncertainties and contingencies which are difficult or impossible to predict and are beyond our control, IMPERIAL PETROLEUM INC. cannot assure you that it will achieve or accomplish these expectations, beliefs or projections. Important factors that, in our view, could cause actual results to differ materially from those discussed in the forward-looking statements include the strength of world economies and currencies, geopolitical conditions, including any trade disruptions resulting from tariffs and other protectionist measures imposed by the United States or  other countries,  general market conditions, including changes in charter hire rates and vessel values, charter counterparty performance, changes in demand that may affect attitudes of time charterers to scheduled and unscheduled drydockings, changes in IMPERIAL PETROLEUM INC’s operating expenses, including bunker prices, drydocking and insurance costs, ability to complete the acquisitions of our four contracted vessels and to fund the purchase price for these and other recently acquired vessels, ability to obtain financing and comply with covenants in our financing arrangements, actions taken by regulatory authorities, potential liability from pending or future litigation, domestic and international political conditions, the conflict in Ukraine and related sanctions, the conflicts in the Middle East, potential disruption of shipping routes due to ongoing attacks by Houthis in the Red Sea and Gulf of Adenand the effective closure of the Persian Gulf, including the Strait of Hormuz, due to the conflict between Iran and the U.S. and Israel, or accidents and political events or acts by terrorists.

Risks and uncertainties are further described in reports filed by IMPERIAL PETROLEUM INC. with the U.S. Securities and Exchange Commission.

Fleet List and Fleet Deployment
For information on our fleet and further information:
Visit our website at www.ImperialPetro.com

Company Contact:
Fenia Sakellaris
IMPERIAL PETROLEUM INC.
E-mail: info@ImperialPetro.com

Fleet Data:
The following key indicators highlight the Company’s operating performance during the periods ended June 30, 2025 and June 30, 2026.

 FLEET DATA Q2 2025 Q2 2026 6M 2025 6M 2026
Average number of vessels (1) 14.1 21.0 13.0 20.4
Period end number of owned vessels in fleet 19 21 19 21
Total calendar days for fleet (2) 1,284 1,909 2,355 3,698
Total voyage days for fleet (3) 1,237 1,704 2,304 3,468
Fleet utilization (4) 96.3% 89.3% 97.8% 93.8%
Total charter days for fleet (5) 764 955 1,268 2,014
Total spot market days for fleet (6) 473 749 1,036 1,454
Fleet operational utilization (7) 83.1% 73.5% 83.4% 80.9%

1) Average number of vessels is the number of owned vessels that constituted our fleet for the relevant period, as measured by the sum of the number of days each vessel was a part of our fleet during the period divided by the number of calendar days in that period.
2) Total calendar days for fleet are the total days the vessels we operated were in our possession for the relevant period including off-hire days associated with major repairs, drydockings or special or intermediate surveys.
3) Total voyage days for fleet reflect the total days the vessels we operated were in our possession for the relevant period net of off-hire days associated with major repairs, drydockings or special or intermediate surveys.
4) Fleet utilization is the percentage of time that our vessels were available for revenue generating voyage days, and is determined by dividing voyage days by fleet calendar days for the relevant period.
5) Total charter days for fleet are the number of voyage days the vessels operated on time or bareboat charters for the relevant period.
6) Total spot market charter days for fleet are the number of voyage days the vessels operated on spot market charters for the relevant period.
7) Fleet operational utilization is the percentage of time that our vessels generated revenue and is determined by dividing voyage days excluding idle days by fleet calendar days for the relevant period.

Reconciliation of Adjusted Net Income, EBITDA, adjusted EBITDA and adjusted EPS:

Adjusted net income represents net income before share based compensation. EBITDA represents net income before interest and finance costs, interest income and depreciation. Adjusted EBITDA represents net income before interest and finance costs, interest income, depreciation and share based compensation.

Adjusted EPS represents Adjusted net income divided by the weighted average number of shares. EBITDA, adjusted EBITDA, adjusted net income and adjusted EPS are not recognized measurements under U.S. GAAP. Our calculation of EBITDA, adjusted EBITDA, adjusted net income and adjusted EPS may not be comparable to that reported by other companies in the shipping or other industries. In evaluating Adjusted EBITDA, Adjusted net income and Adjusted EPS, you should be aware that in the future we may incur expenses that are the same as or similar to some of the adjustments in this presentation.

EBITDA, adjusted EBITDA, adjusted net income and adjusted EPS are included herein because they are a basis, upon which we and our investors assess our financial performance. They allow us to present our performance from period to period on a comparable basis and provide investors with a means of better evaluating and understanding our operating performance. Management also uses these non-GAAP financial measures in making financial, operating and planning decisions and in evaluating our performance.

(Expressed in United States Dollars,
except number of shares)
Second Quarter Ended
June 30th,
Six Months Period Ended
June 30th,
  2025 2026 2025 2026
Net Income – Adjusted Net Income        
Net income 12,759,434 34,758,699 24,050,420 62,779,787
Plus share based compensation 671,643 519,451 1,560,719 1,101,156
Adjusted Net Income 13,431,077 35,278,150 25,611,139 63,880,943
         
Net income – EBITDA        
Net income 12,759,434 34,758,699 24,050,420 62,779,787
Plus interest and finance costs 838,089 383,595 1,444,472 592,147
Less interest income (2,274,170) (2,111,496) (4,458,564) (3,921,937)
Plus depreciation 5,746,291 8,194,580 10,749,128 16,125,505
EBITDA 17,069,644 41,225,378 31,785,456 75,575,502
         
Net income – Adjusted EBITDA        
Net income 12,759,434 34,758,699 24,050,420 62,779,787
Plus share based compensation 671,643 519,451 1,560,719 1,101,156
Plus interest and finance costs 838,089 383,595 1,444,472 592,147
Less interest income (2,274,170) (2,111,496) (4,458,564) (3,921,937)
Plus depreciation 5,746,291 8,194,580 10,749,128 16,125,505
Adjusted EBITDA 17,741,287 41,744,829 33,346,175 76,676,658
         
EPS        
Numerator        
Net income 12,759,434 34,758,699 24,050,420 62,779,787
Less: Cumulative dividends on preferred shares (435,246) (435,246) (870,492) (870,492)
Less: Undistributed earnings allocated to non-vested shares (410,718) (517,685) (869,583) (1,041,668)
Net income attributable to common shareholders, basic 11,913,470 33,805,768 22,310,345 60,867,627
Denominator        
Weighted average number of shares 33,267,487 45,350,830 33,107,097 45,338,067
EPS – Basic 0.36 0.75 0.67 1.34
         
Adjusted EPS        
Numerator        
Adjusted net income 13,431,077 35,278,150 25,611,139 63,880,943
Less: Cumulative dividends on preferred shares (435,246) (435,246) (870,492) (870,492)
Less: Undistributed earnings allocated to non-vested shares (433,101) (525,519) (928,132) (1,060,195)
Adjusted net income attributable to common shareholders, basic 12,562,730 34,317,385 23,812,515 61,950,256
         
Denominator        
Weighted average number of shares 33,267,487 45,350,830 33,107,097 45,338,067
Adjusted EPS 0.38 0.76 0.72 1.37

Imperial Petroleum Inc.
Unaudited Consolidated Statements of Income
(Expressed in United States Dollars, except for number of shares)

          Quarters Ended June 30,   Six Month Periods Ended June 30,
          2025   2026   2025   2026
                 
Revenues                    
  Revenues     36,348,819   87,073,466   68,440,445   148,786,861
                       
Expenses/(Income)                    
  Voyage expenses     10,271,965   21,058,763   20,326,079   33,065,678
  Voyage expenses – related party   432,863   1,036,218   834,616   1,785,657
  Vessels’ operating expenses   8,297,520   14,192,655   15,319,448   25,267,523
  Vessels’ operating expenses – related party 109,000   160,000   207,500   335,000
  Drydocking costs     1,692,033   7,525,438   1,692,033   8,959,177
  Management fees – related party     564,960   839,960   1,036,200   1,627,120
  General and administrative expenses   1,064,964   1,097,701   2,282,941   2,152,123
  Depreciation     5,746,291   8,194,580   10,749,128   16,125,505
  Other operating income     —   (430,324)   —   (430,324)
Total expenses, net     28,179,596   53,674,991   52,447,945   88,887,459
                       
Income from operations   8,169,223   33,398,475   15,992,500   59,899,402
                       
Other (expenses)/income                
  Interest and finance costs   (3,115)   (4,471)   (6,722)   (8,618)
  Interest expense – related party   (834,974)   (379,124)   (1,437,750)   (583,529)
  Interest income     2,274,170   2,111,496   4,458,564   3,921,937
  Dividend income from related party     189,583   189,583   377,083   377,083
  Foreign exchange gain/(loss)   2,964,547   (557,260)   4,666,745   (826,488)
Other income, net     4,590,211   1,360,224   8,057,920   2,880,385
                       
Net Income     12,759,434   34,758,699   24,050,420   62,779,787
                       
Earnings per share                  
– Basic       0.36   0.75   0.67   1.34
– Diluted       0.35   0.70   0.65   1.27
                       
Weighted average number of shares              
– Basic       33,267,487   45,350,830   33,107,097   45,338,067
– Diluted       35,172,985   48,126,056   34,407,373   47,874,673


Imperial Petroleum Inc.

Unaudited Consolidated Balance Sheets
(Expressed in United States Dollars)

          December 31,   June 30,
          2025   2026
               
Assets            
Current assets          
  Cash and cash equivalents   5,771,505   7,518,702
  Time deposits     173,282,440   237,712,000
  Trade and other receivables   13,403,555   18,666,099
  Other current assets     1,107,956   1,239,819
  Claims receivable     479,488   909,813
  Inventories     4,720,873   10,422,022
  Advances and prepayments   245,014   671,496
Total current assets     199,010,831   277,139,951
               
Non current assets          
  Operating lease right-of-use asset   —   263,445
  Vessels, net     335,406,781   354,689,276
  Investment in related party   12,990,167   12,983,917
Total non current assets     348,396,948   367,936,638
Total assets       547,407,779   645,076,589
               
Liabilities and Stockholders’ Equity        
Current liabilities          
  Trade accounts payable   5,959,924   13,859,897
  Payable to related parties   3,038,447   35,151,918
  Accrued liabilities     4,195,986   6,373,316
  Operating lease liability, current portion   —   100,985
  Deferred income     3,399,325   2,653,956
Total current liabilities     16,593,682   58,140,072
           
Non current Liabilities          
Operating lease liability, non-current portion     —   162,460
Total non-current liabilities     —   162,460
Total liabilities     16,593,682   58,302,532
               
Commitments and contingencies        
               
Stockholders’ equity          
  Capital stock     489,006   504,406
  Preferred Stock, Series A   7,959   7,959
  Preferred Stock, Series B   160   160
  Treasury stock   (8,390,225)   (19,020,716)
  Additional paid-in capital   344,445,271   349,111,027
  Retained earnings     194,261,926   256,171,221
Total stockholders’ equity     530,814,097   586,774,057
Total liabilities and stockholders’ equity   547,407,779   645,076,589


Imperial Petroleum Inc.

Unaudited Consolidated Statements of Cash Flows
(Expressed in United States Dollars)

          Six Month Periods Ended June 30,
          2025   2026
           
Cash flows from operating activities        
  Net income for the period     24,050,420   62,779,787
               
Adjustments to reconcile net income to net cash      
provided by operating activities:        
  Depreciation     10,749,128   16,125,505
  Non-cash lease expense 38,849   46,941
  Share-based compensation   1,560,719   1,101,156
  Unrealized foreign exchange loss/(gain) on time deposits     (1,030,640)   586,884
               
Changes in operating assets and liabilities:      
  (Increase)/decrease in          
  Trade and other receivables   670,769   (5,262,544)
  Other current assets     485,977   (131,863)
  Claims receivable     —   (430,325)
  Inventories     1,319,526   (5,701,149)
  Changes in operating lease liabilities   (38,849)   (46,941)
  Advances and prepayments   25,021   (426,482)
  Due from related parties   2,084   6,250
  Increase/(decrease) in          
  Trade accounts payable   955,699   7,899,973
  Due to related parties   2,990,748   291,101
  Accrued liabilities     (132,345)   2,177,330
  Deferred income     765,748   (745,369)
Net cash provided by operating activities   42,412,854   78,270,254
               
Cash flows from investing activities        
  Payments for improvement and capitalized expenses of vessels (417,320)   —
  Increase in bank time deposits   (101,608,390)   (331,215,788)
  Maturity of bank time deposits   157,081,011   266,199,344
Net cash provided by/(used in) investing activities   55,055,301   (65,016,444)
               
Cash flows from financing activities        
  Stock repurchases     —   (10,630,491)
  Dividends paid on preferred shares   (868,075)   (876,122)
  Repayment of seller and capital expenditures financing   (36,700,000)   —
Net cash used in financing activities   (37,568,075)   (11,506,613)
               
Net increase in cash and cash equivalents 59,900,080   1,747,197
Cash and cash equivalents at beginning of period 67,783,531   5,771,505
Cash and cash equivalents at end of period 127,683,611   7,518,702
Cash breakdown        
  Cash and cash equivalents   127,683,611   7,518,702
Total cash and cash equivalents shown in the statements of cash flows 127,683,611   7,518,702

Access the segment here

ISELIN, N.J., Sept. 10, 2026 (GLOBE NEWSWIRE) — Outlook Therapeutics, Inc. (Nasdaq: OTLK), a biopharmaceutical company focused on the development and commercialization of LYTENAVA™ (bevacizumab-vikg, bevacizumab gamma) for the treatment of retinal diseases, today announced that Bob Jahr, Chief Executive Officer, recently participated in a Virtual Investor CEO Connect segment discussing the significance of the FDA approval of LYTENAVA and the Company’s plans for its U.S. commercial launch.

During the segment, Mr. Jahr discusses the potential of LYTENAVA to address the significant U.S. retina market by providing physicians with the only FDA-approved ophthalmic formulation of bevacizumab for wet AMD. He also discusses the Company’s potential to shift existing off-label use to LYTENAVA and its opportunity to achieve more than $500 million in annual U.S. sales by 2030.

The segment also highlights Outlook Therapeutics’ commercial readiness efforts ahead of its planned U.S. launch before the end of 2026, including manufacturing, distribution, market access, reimbursement, and physician education, as well as key learnings from the Company’s commercialization efforts in Europe.

“FDA approval of LYTENAVA marks an important transformation for Outlook Therapeutics as we move into our next phase as a commercial-stage company,” said Bob Jahr. “We believe LYTENAVA has the potential to make a meaningful impact for retina physicians and patients while addressing a significant market opportunity. We are focused on executing our U.S. launch strategy and building on the experience gained through our European commercialization efforts.”

The Virtual Investor CEO Connect segment is available to watch here.

About LYTENAVA™ (bevacizumab-vikg, bevacizumab gamma)

LYTENAVA™ is an ophthalmic formulation of bevacizumab produced in the United States for the treatment of wet AMD. In the United States, LYTENAVA (bevacizumab-vikg) is the only ophthalmic formulation approved by the FDA. LYTENAVA (bevacizumab gamma) is also the subject of a centralized Marketing Authorization granted by the European Commission in the EU and Marketing Authorization granted by the Medicines and Healthcare products Regulatory Agency (MHRA) in the UK for the treatment of wet AMD. In certain European Union Member States, LYTENAVA must receive pricing and reimbursement approval before it can be sold.

Bevacizumab-vikg (bevacizumab gamma in the EU and UK) is a recombinant humanized IgG1 monoclonal antibody specific to human vascular endothelial growth factor (VEGF). Bevacizumab binds VEGF and prevents the interaction of VEGF to its receptors (Flt-1 and KDR) on the surface of endothelial cells. LYTENAVA binds to all isoforms of VEGF-A, thereby preventing interaction with receptors VEGFR-1 and VEGFR-2. By inhibiting VEGF-A, LYTENAVA suppresses endothelial cell proliferation, neovascularization, and vascular permeability. Inhibition of such activity targets a pathophysiologic process that contributes to vision loss.

Important Safety Information and Indication

LYTENAVA (bevacizumab-vikg) is a vascular endothelial growth factor (VEGF) inhibitor indicated for the treatment of patients with neovascular (wet) age-related macular degeneration (nAMD).

Contraindications

LYTENAVA is contraindicated in patients with ocular or periocular infections, in patients with active intraocular inflammation, and in patients with a known hypersensitivity to bevacizumab products or any of the ingredients in LYTENAVA. Hypersensitivity reactions may manifest as severe intraocular inflammation.

Warnings and Precautions

Intravitreal injections have been associated with endophthalmitis and retinal detachments. Proper aseptic injection technique must always be used when administering LYTENAVA. In addition, patients should be monitored following the injection to permit early treatment should an infection occur.

Increases in intraocular pressure have been noted post-injection (up to 60 minutes) while being treated with LYTENAVA. Monitor intraocular pressure prior to and following intravitreal injection with LYTENAVA and manage appropriately.

Although there was a low rate of arterial thromboembolic events (ATEs) observed in the LYTENAVA clinical trials, there is a potential risk of ATEs following intravitreal use of VEGF inhibitors. ATEs are defined as nonfatal stroke, nonfatal myocardial infarction, or vascular death (including deaths of unknown cause).

Adverse Reactions

The most common adverse reaction (≥1%) reported in patients receiving LYTENAVA was conjunctival hemorrhage (4%), eye pain (2%), and vitreous floaters (2%). These are not all the possible side effects of LYTENAVA.

You are encouraged to report side effects of prescription drugs to the FDA.

Visit www.fda.gov/medwatch or call 1-800-FDA-1088. You may also report side effects to Outlook Therapeutics at 1-833-999-OTLK (6855).

Please see the full U.S. Prescribing Information for LYTENAVA here.

About Outlook Therapeutics, Inc.

Outlook Therapeutics is a biopharmaceutical company focused on the development and commercialization of LYTENAVA (bevacizumab-vikg (U.S.), bevacizumab gamma (E.U.)). LYTENAVA is the only ophthalmic formulation of bevacizumab to receive U.S. FDA approval and European Commission and MHRA Marketing Authorization for the treatment of wet AMD. Outlook Therapeutics commenced commercial launch of LYTENAVA (bevacizumab gamma) in Germany, Austria, and the UK as a treatment for wet AMD.

Forward-Looking Statements

This press release contains statements that may or are considered “forward-looking statements”. All statements other than statements of historical facts are “forward-looking statements,” including those relating to future events. In some cases, you can identify forward-looking statements by terminology such as “anticipate,” “believe,” “can,” “could,” “continue,” “expect,” “may,” “on track,” “plan,” “potential,” “target,” “will,” or “would”, the negative of terms like these or other comparable terminology, and other words or terms of similar meaning. These include, among others, express or implied discussions regarding the Company’s planned launch of LYTENAVA in the United States and other jurisdictions and the timing thereof; expectations concerning potential revenue generation from sales of LYTENAVA; expectations surrounding market adoption of LYTENAVA; expectations regarding the potential impact of LYTENAVA in the retina community; Outlook Therapeutics’ development or future revenue plans for LYTENAVA generally; and other statements that are not historical fact. Although Outlook Therapeutics believes that it has a reasonable basis for the forward-looking statements contained herein, they are based on current expectations about future events affecting Outlook Therapeutics and are subject to risks, uncertainties, and factors relating to its operations and business environment, all of which are difficult to predict and many of which are beyond its control. These risk factors include those risks associated with developing and commercializing pharmaceutical product candidates, risks in obtaining necessary regulatory approvals, the content and timing of decisions by regulatory bodies, as well as those risks detailed in Outlook Therapeutics’ filings with the Securities and Exchange Commission (the SEC), including the Current Report on Form 8-K filed with the SEC on August 12, 2026 and the Quarterly Report on Form 10-Q for the quarter ended June 30, 2026, and future reports Outlook Therapeutics files with the SEC, which include uncertainty of market conditions and future impacts related to macroeconomic factors, including as a result of the ongoing overseas conflicts, tariffs, and trade tensions, fluctuations in interest rates and inflation, and potential future bank failures on the global business environment. These risks may cause actual results to differ materially from those expressed or implied by forward-looking statements in this press release. All forward-looking statements included in this press release are expressly qualified in their entirety by the foregoing cautionary statements. You are cautioned not to place undue reliance on these forward-looking statements, which speak only as of the date hereof. Outlook Therapeutics does not undertake any obligation to update, amend, or clarify these forward-looking statements, whether as a result of new information, future events, or otherwise, except as may be required under applicable securities law.

Investor Inquiries:
Jenene Thomas
Chief Executive Officer
JTC Team, LLC
T: 908.824.0775
OTLK@jtcir.com

A small group of experienced marketers and political organizations begins putting live campaigns through Totaligent’s unified communications platform, not to hunt bugs, but to run work.

BOCA RATON, Fla., Sept. 10, 2026 (GLOBE NEWSWIRE) — Totaligent, Inc. (OTCID: TGNT) (“Totaligent” or “the Company”) today announced the opening of Phase I of its Founders Pilot, an invitation-only, real-world deployment of the Company’s communications operating system with a small group of sophisticated clients and political organizations already performing live campaigns through the platform.

Phase I participants are not clicking around looking for bugs. They are operators, experienced marketers and organizations, running actual commercial and campaign work inside Totaligent: audience creation, omnichannel distribution, measurement, onboarding, billing, support, and scale under live conditions.

“Software that only works in a demo is still a demo,” said Ted DeFeudis, Chief Executive Officer of Totaligent. “We know the software is solid, but now we need to know how a campaign performs across the various integrated modules, in a real-world environment. Phase I is invite-only because the first users have to be people who already know how to run a book of work, and who will tell us, in production, what the system still owes them.”

Phase I: Founders Pilot

Phase I is a limited, invitation-only cohort. Participants begin using Totaligent in live environments to validate the full operating loop the Company intends to commercialize:

Workflows: one audience, every channel, one source of truth across email, SMS, social, audience creation, and programmatic advertising. AI landing-page creation and publishing, plus every Google and native ad size.

Onboarding: domain, DNS, identity, and account setup under real client conditions;

Billing and commercial use: how work is priced, invoiced, and supported when campaigns are actually in market;

Scale and support: volume, concurrency, attribution, and operator response when the work is not hypothetical.

The purpose is to prove the platform in live production: that the full operating loop can run real campaigns, end to end, under actual commercial and campaign conditions. Totaligent said Phase I is designed to confirm that unified communications infrastructure (Smart Capture, Smart Engage, Smart Links, and Smart Cookies) on a shared ledger can track and carry live campaigns uninterrupted.

That premise was set out in White Paper No. 1, published September 3, 2026, in the Company’s Future of Enterprise Communications series. The paper argued that enterprise marketing software has become a memory problem: U.S. internet advertising reached a record $294.6 billion in 2025 while typical on-site conversion remains under 3 percent, and the landscape now includes more than 15,500 commercial marketing-technology products with utilization still near half of what marketers already pay for. Phase I is the first operating test of the alternative the paper described; a system AI can run because the system can remember.

Who Is Invited, and Who Is Not

Access in Phase I is restricted. The Company is seating experienced growth teams, operators, and political organizations that already run campaigns at a level where workflow, identity, compliance, and measurement are not theoretical. Public self-serve enrollment is not part of this stage.

Totaligent opened a public beta of its consumer-facing platform on March 5, 2025, and on December 23, 2025 announced completion of quality-assurance testing across the core marketing and campaign platform. The Founders Pilot is the next step in that sequence: from architecture and QA to live use by operators who will keep the resulting relationship, not rent it back from another vendor next quarter.

“We did not bolt a chatbot onto the stack,” DeFeudis said, restating the design line from the white paper. “The platform is built for agents to operate inside it. Phase I is the foundation that makes all the pieces work together.”

Next

The Company said it will expand the Founders program only as Phase I confirms onboarding, billing, support, and campaign performance under load. Operators interested in later Founders access may write contact@totaligent.com. White Paper No. 1 remains available at www.totaligent.com/whitepaper1

About Totaligent, Inc.

Totaligent, Inc. (OTCID: TGNT) develops person-based digital communications infrastructure for organizations that need to create audiences, launch omnichannel campaigns, and keep the resulting relationship. The Company’s platform is designed to unify email, bulk SMS, social, audience creation, and programmatic advertising, together with audience intelligence, AI creative production, attribution, and automation, inside one operating environment.

Totaligent’s architecture is intended to replace a fragmented marketing software stack with a communications system built so AI can operate it, not merely decorate it. For more information, visit www.totaligent.com.

Forward-Looking Statements

This press release contains forward-looking statements within the meaning of Section 27A of the Securities Act of 1933 and Section 21E of the Securities Exchange Act of 1934. These statements involve known and unknown risks, uncertainties, and other factors that may cause actual results to differ materially from those expressed or implied. Such risks include, but are not limited to, the Company’s ability to execute its platform strategy, realize the anticipated benefits of its architecture and product roadmap, complete the Founders Pilot and subsequent commercial phases on the expected timetable, adapt to rapidly evolving artificial intelligence technologies, compete in enterprise software and digital-advertising markets, obtain additional capital, and achieve commercial milestones. Third-party market statistics cited in prior Company materials and in this release are estimates that may be revised. Readers are cautioned not to place undue reliance on these forward-looking statements, which speak only as of the date hereof. The Company undertakes no obligation to update any forward-looking statements.

Investor Relations
ir@totaligent.com
Ben Hansel (720) 288-8495
Totaligent, Inc. | 3651 FAU Blvd, Suite 400, Boca Raton, FL 33431 | (561) 360-3565

Media / Founders Pilot inquiries: contact@totaligent.com

Person subject to the notification requirement
Name: Ninnas, Toivo
Position: Member of the Supervisory Board

Issuer: AS Tallink Grupp
LEI: 529900QRMWAKKR3L9W75

Notification type: Initial Notification

Transaction date: 10.09.2026
Place of transaction: OTC
Instrument type: Share
ISIN: EE3100004466
Nature of the transaction: exercise of a stock option
(X) linked to stock option program

Transaction details:
(1): Volume: 300,000; Unit price: 0.47 EUR

Aggregated transactions:
(1): Volume: 300,000; Volume weighted average price: 0.47 EUR

Anneli Simm
Investor Relations Manager

AS Tallink Grupp
Sadama 5
10111 Tallinn
E-mail: Anneli.simm@tallink.ee
Phone: +372 56157170

Person subject to the notification requirement
Name: Ninnas, Toivo
Position: Member of the Supervisory Board

Issuer: AS Tallink Grupp
LEI: 529900QRMWAKKR3L9W75

Notification type: Initial Notification

Transaction date: 10.09.2026
Place of transaction: OTC
Instrument type: Share
ISIN: EE3100004466
Nature of the transaction: exercise of a stock option
(X) linked to stock option program

Transaction details:
(1): Volume: 300,000; Unit price: 0.47 EUR

Aggregated transactions:
(1): Volume: 300,000; Volume weighted average price: 0.47 EUR

Anneli Simm
Investor Relations Manager

AS Tallink Grupp
Sadama 5
10111 Tallinn
E-mail: Anneli.simm@tallink.ee
Phone: +372 56157170

Order from a leading Israeli defense prime, supports a European production line for a critical air-defense system

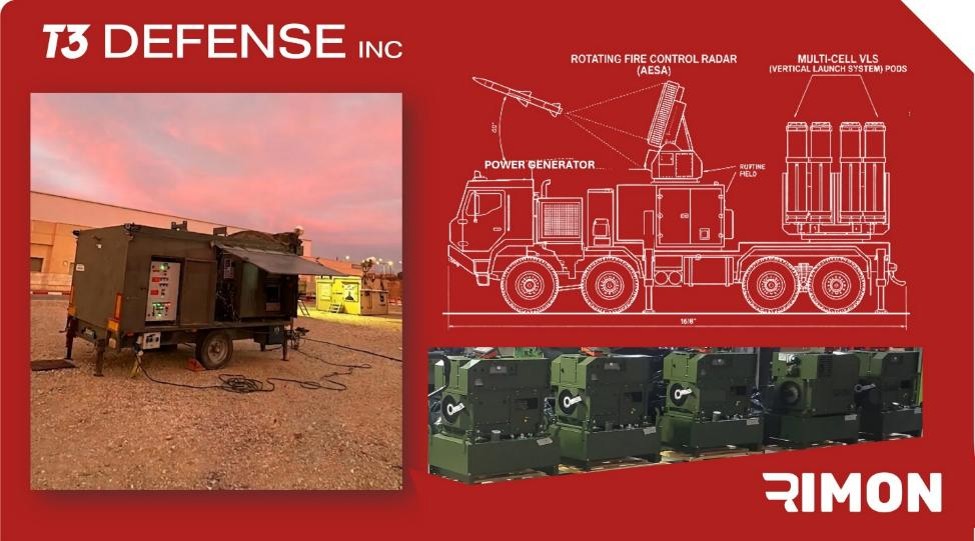
NEW YORK and NETANYA, Israel, Sept. 10, 2026 (GLOBE NEWSWIRE) — T3 Defense Inc. (Nasdaq: DFNS) (“T3 Defense” or the “Company”), a defense company that acquires and operates mission-critical defense businesses involved in national security programs, today announced that its wholly owned subsidiary, Rimon Agencies Ltd. (“Rimon”), has received a purchase order valued at approximately $1.3 million from a leading Israeli defense prime contractor. Rimon will supply engineered power-generation systems for a European production line supporting a critical air-defense system.

Photo

The equipment will be built and configured to the prime contractor’s specifications and the requirements of serial defense production, with deliveries scheduled for the customer’s European production facility.

This order is the first Rimon purchase order tied to European air-defense production activity, demonstrating demand for its engineered power-generation systems in a critical defense-production environment.

“Europe’s continued investment in layered air defense would create demand for the sub-systems our businesses provide,” said Menny Shalom, Chairman and Chief Executive Officer of T3 Defense. “This order from a leading Israeli prime contractor is a tangible example of that demand. Rimon has been selected to supply power-generation systems for a critical air-defense production line in Europe, reinforcing the strategic relevance of the portfolio we have assembled, and it opens a path for Rimon into the European air-defense supply chain, where we see multi-year, program-driven demand for exactly this class of hardware.”

“This is a production-line order, not a one-off delivery, that reflects Rimon’s engineering and manufacturing capabilities and established record supporting Israel’s most demanding customers,” said Itamar Shimoni, Chief Executive Officer of Rimon. “Power generation is where Rimon started, and supplying it into a European defense production environment is a significant step in the expansion of our footprint beyond Israel. We are preparing for the initial delivery phase while continuing to evaluate and invest in building the capacity required to support additional volume from this customer and others.”

Portfolio Context

T3 Defense continues to position its operating subsidiaries, including Rimon, Positech, Tiltan, ITS, and Nimbus across the mission-critical hardware and systems used in defense and counter-drone programs. The Company’s portfolio spans launcher systems, tactical mobility, power generation, positioning and navigation, command-and-control, and training and simulation capabilities that support the deployment, operation and sustainment of layered defense architectures.

Rimon’s recent performance reflects growing demand for its capabilities. As of July 31, 2026, Rimon had generated approximately $5.25 million in year-to-date revenue, already exceeding its full-year 2025 revenue of $4.6 million. As of the same date, Rimon had approximately $2.1 million in backlog scheduled for delivery through year-end. The new order has been added to that backlog.

Through its subsidiaries, T3 Defense seeks to serve defense customers and prime contractors in Israel, Europe and other allied markets, where modernization, readiness and force-protection requirements are driving demand for these categories of equipment and support.

About Rimon

Rimon is a bespoke engineering and systems integration company that develops mission-ready infrastructure platforms for defense, homeland security, and emergency response operations. The company imports, distributes, and upgrades mobile power systems, elevated sensor masts, and builds integrated mission vehicles that support surveillance, communications, and command systems operating in environments where permanent infrastructure is unavailable. By engineering systems around real operational requirements, Rimon enables critical technologies to be deployed rapidly and operate reliably in demanding field conditions.

About T3 Defense Inc.

T3 Defense Inc. (Nasdaq: DFNS) is a defense company that acquires and operates mission-critical defense businesses involved in national security programs. It focuses on manufacturers with strong customer relationships and solid order backlogs, often capacity- and resource-constrained, in specialized areas such as drones and autonomous vehicles, counter-drone systems, advanced manufacturing, tactical robotics, and AI software and system integration. Through disciplined acquisitions, centralized capital and strategy, and decentralized day-to-day operations, T3 Defense aims to strengthen essential defense capabilities and build long-term value. For more information, visit www.t3dfns.com.

Forward-Looking Statements

This press release contains forward-looking statements within the meaning of Section 27A of the Securities Act of 1933, as amended, and Section 21E of the Securities Exchange Act of 1934, as amended. All statements other than statements of historical fact are forward-looking statements, including, without limitation, statements regarding the anticipated timing, phasing and completion of deliveries under the order described herein; the recognition of revenue from such order; the potential for follow-on, recurring or additional orders from the customer or other parties; European air- and missile-defense demand and procurement trends; the potential for Rimon or the Company’s other subsidiaries to qualify into or participate in European defense supply chains; Rimon’s operational expansion plans; and the Company’s growth and acquisition strategy. These statements are based on management’s current expectations and assumptions and involve known and unknown risks and uncertainties that could cause actual results to differ materially from those expressed or implied, including: the risk that the order is modified, delayed, reduced or cancelled by the customer; customer acceptance, testing and qualification requirements; export-control, licensing, local-content and shipping requirements applicable to deliveries to Europe; the risk that a single order is not indicative of future orders or of participation in any broader program; dependence on a limited number of defense prime contractors and customer concentration; defense program funding, procurement timing and the pace of European production activity; manufacturing execution, capacity and supply-chain risks, including the availability of components; the risk that backlog does not convert into revenue; competitive and geopolitical conditions, including conditions in Israel and in Europe; the Company’s liquidity and capital resources; the Company’s ability to maintain compliance with Nasdaq listing requirements; the integration of acquired businesses; and other risks described in the Company’s filings with the Securities and Exchange Commission, including its Annual Report on Form 10-K, Quarterly Reports on Form 10-Q, and Current Reports on Form 8-K. Forward-looking statements speak only as of the date of this release, and the Company undertakes no obligation to update or revise them, except as required by law.

Contact Us:

T3 Defense Inc.
575 5th Avenue
New York, NY 10017
contact@t3dfns.com
www.t3dfns.com

Rimon
Chen Ganzer
chen.ganzer@rimon1.com

Investor Relations
The Equity Group Inc.
Lena Cati
lena.cati@theequitygroup.com
+1 212 836-9611

Val Ferraro
val.ferraro@theequitygroup.com
+1 212 836-9633

A photo accompanying this announcement is available at https://www.globenewswire.com/NewsRoom/AttachmentNg/358e2d78-f966-49aa-bba1-c1ac294d8e9e

The public limited liability company Invalda INVL (hereinafter – the Company) announces that on 10 September 2026 it redeemed all notes of the note issue ISIN LT0000409229.

Noteholders were paid 100% of the nominal value of the notes (EUR 1,000 per note), together with accrued and unpaid interest up 10 September 2026 (but excluding it), in accordance with the provisions of the General Terms and Conditions of the Notes of the Base prospectus of the company’s EUR 25,000,000 programme for the issuance of notes, approved by the Bank of Lithuania on 28 May 2024.

As the Company had announced on 10 August 2026, this redemption was carried out ahead of the scheduled maturity date (14 June 2027), by exercising the provided early redemption right.

Following the redemption of the notes, all of the issuer’s obligations under the note issue ISIN LT0000409229 have been fulfilled.

On 10 September 2026, i.e. the date of their early redemption, the Company’s notes (IVLB070027A, ISIN code LT0000409229) are removed from the Baltic Bond List.

Further information:
Darius Šulnis
CEO of Invalda INVL
darius.sulnis@invl.com

Multi-year agreement aligns Codere Online with one of the world’s most valuable and recognized sports brands

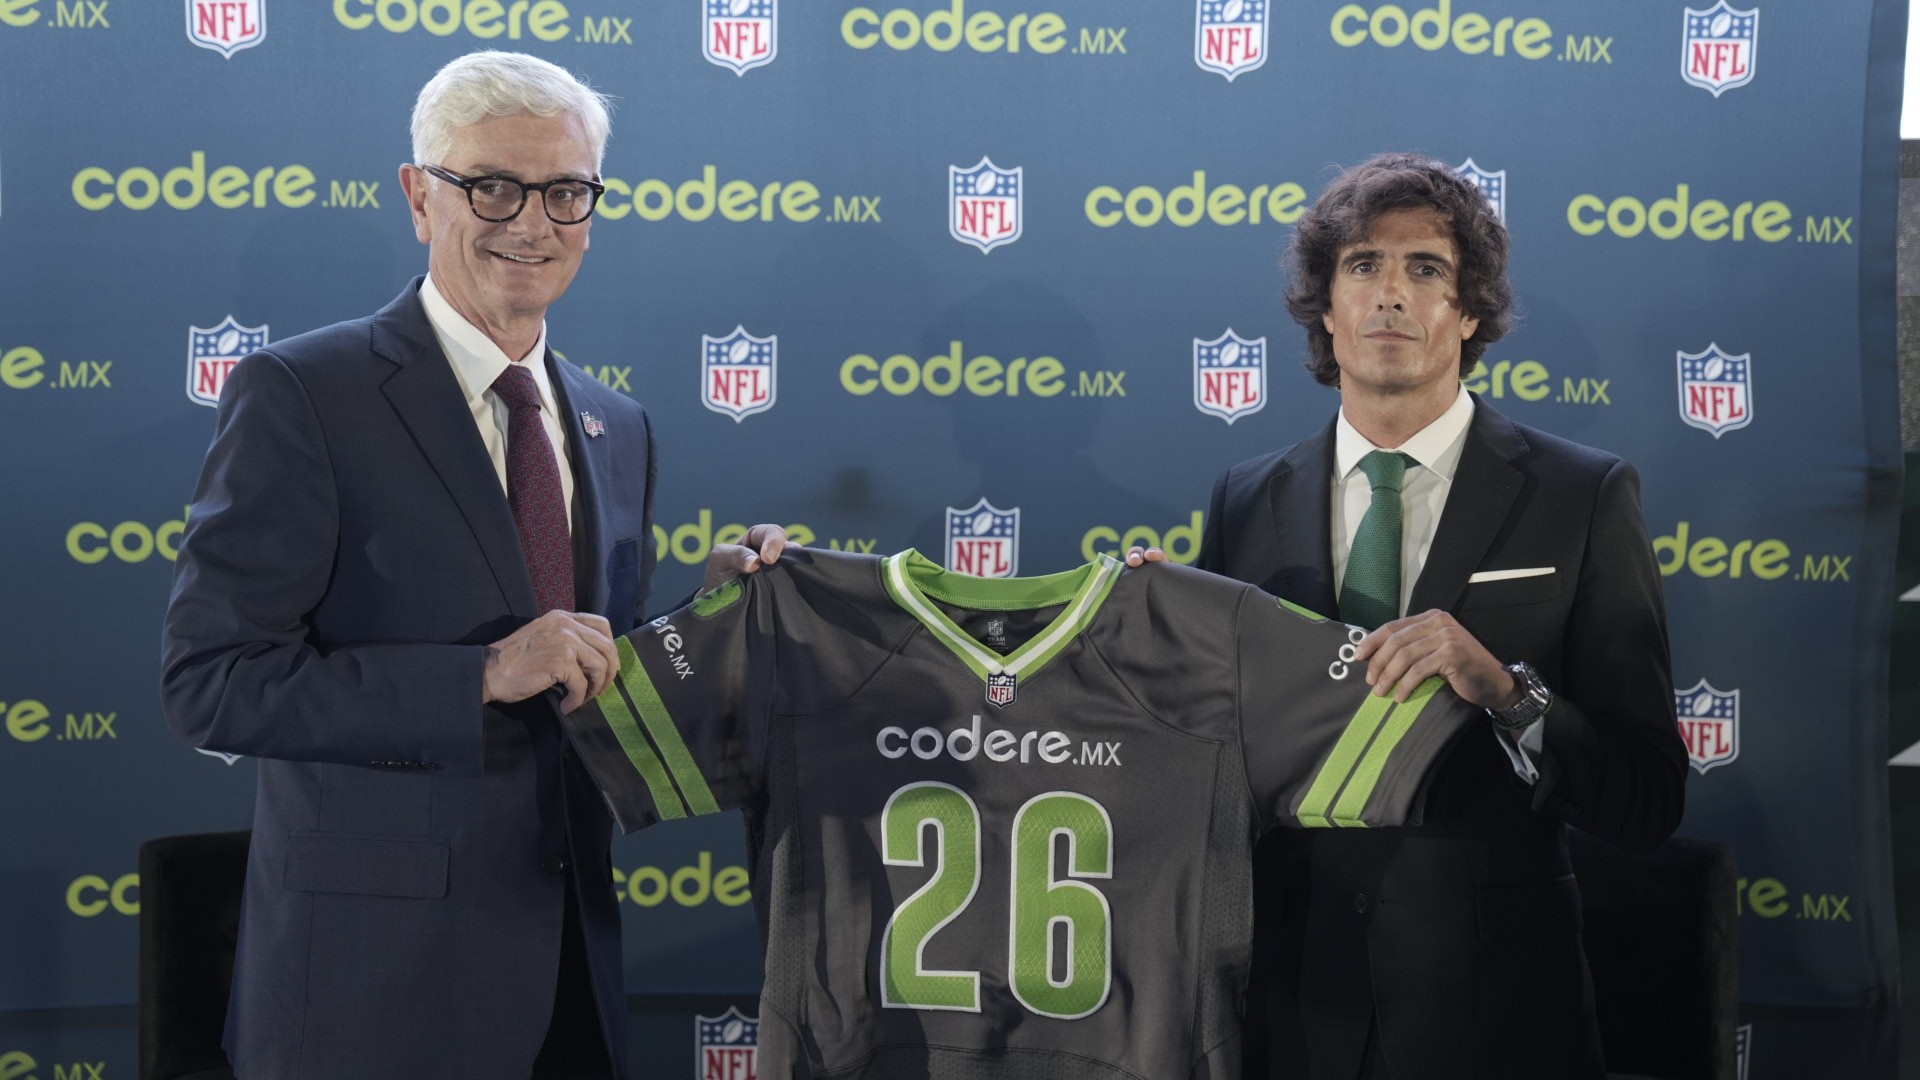
Mexico City, Mexico, September 10, 2026 – (GLOBE NEWSWIRE) Codere Online (Nasdaq: CDRO / CDROW, the “Company”), a leading online gaming and sports betting operator in Spain and Latin America, today announced a landmark multi-year agreement with the National Football League (NFL) in Mexico.

By joining forces with one of the world’s most iconic, valuable and widely recognized sports brands, Codere Online reinforces its premium positioning and continues its strategy of building long-term associations with world-class sports properties. The agreement also marks an important new chapter in the Company’s commitment to sports and entertainment in Mexico, one of its largest and most strategically important markets.

Under the agreement, Codere Online will become:

  • Official Betting Partner of the NFL in Mexico
  • Official Partner of Super Bowl LXI
  • Official Partner of the NFL Mexico Game
  • Official Sports Betting Sponsor

The partnership places Codere Online alongside one of the most influential brands in global sports and reinforces the Company’s ambition to remain associated with properties of the highest international profile. With a powerful year-round platform, a highly engaged fan community and some of the world’s most prominent sporting events, the NFL provides Codere Online with a unique opportunity to strengthen brand visibility, deepen customer engagement and deliver premium entertainment experiences in Mexico.

The agreement also demonstrates the continuity of Codere Online’s strategy of partnering with elite sports organizations that combine global recognition with strong local relevance. Mexico is one of the NFL’s most passionate international markets and a core market for Codere Online, making the partnership a natural fit between two established brands with a shared focus on innovation, entertainment and memorable fan experiences.

As part of the partnership, Codere Online will serve as a sponsor of the 2026 NFL Mexico City Game, the regular season matchup scheduled to take place in Mexico City on November 22, 2026, between the San Francisco 49ers and the Minnesota Vikings. The Company will also be an official sponsor of the Super Bowl, which will be held in Los Angeles in February 2027.

The multi-year agreement will create a broad platform for fan engagement, including hospitality programs, VIP experiences, activations across multiple cities in Mexico and official NFL merchandise opportunities. These initiatives will enable Codere Online to connect its customers with one of the most prominent properties in global sports and bring fans closer to the game through exclusive and memorable experiences.

Carlos Sabanza, Director of Sponsorships and Public Relations at Codere Online, said: “ Partnering with the NFL, one of the most iconic and influential brands in global sports, represents an important milestone for Codere Online and reinforces our ambition to remain associated with world-class sports properties. This agreement strengthens our premium positioning while underlining our long-term commitment to Mexico, a market with an extraordinary passion for the NFL. Together, we look forward to creating distinctive experiences that bring fans closer to the game and further enhance our sports betting and entertainment offering.”

Arturo Olivé, Managing Director of NFL Mexico, said: “Mexico is one of the NFL’s most vibrant and important international markets, with millions of passionate fans engaging with our game year-round. We are pleased to welcome Codere Online, one of Mexico’s most established and recognized online gaming and sports betting operators, as a partner. Together, we will elevate the fan experience through innovative activations, exclusive opportunities and unique moments that bring supporters closer to the NFL.”

The collaboration will bring fans NFL-related content and experiences in accordance with standards of responsible gaming, integrity, and regulatory compliance.

For Codere Online, the partnership represents a defining milestone in its growth strategy and the next chapter in its long-standing association with elite international sports. By aligning with one of the world’s most valuable and recognizable sports brands, the Company maintains its premium brand positioning while gaining a powerful platform that combines global scale, year-round relevance and exceptional resonance with Mexican audiences.

The agreement further strengthens Codere Online’s position as a leading online gaming and sports betting operator and expands its ability to offer customers premium experiences around the 2026 NFL Mexico City Game, Super Bowl LXI and the wider NFL season.

About Codere Online

Codere Online refers, collectively, to Codere Online Luxembourg, S.A. and its subsidiaries. Codere Online, launched in 2014 as part of the renowned casino operator Codere Group, offers online sports betting and online casino through its state-of-the art website and mobile applications. Codere Online currently operates in its core markets of Spain, Mexico, Colombia, Panama and Argentina; this online business is complemented by Codere Group’s physical presence in Spain and throughout Latin America, forming the foundation of the leading omnichannel gaming and casino presence.

About Codere Group
Codere Group is a multinational group dedicated to entertainment and leisure. It is a leading player in the private gaming industry, with four decades of experience and with presence in seven countries in Europe (Spain and Italy) and Latin America (Argentina, Colombia, Mexico, Panama, and Uruguay).

Contacts:

Investors and Media
Guillermo Lancha
Director, Investor Relations and Communications
Guillermo.Lancha@codereonline.com
(+34) 628.928.152

About NFL Mexico

NFL Mexico is the local representation of the National Football League, the professional American football league of the United States. With more than 110 years of history in the country, Mexico is one of the NFL’s most important markets outside the United States, and the league established its local office in 1998.

Through the NFL’s Global Markets Program, 10 teams hold marketing rights in Mexico: ARI, DAL, DEN, HOU, KC, LV, LAR, MIA, PIT, and SF. These rights support a wide range of partnerships with media outlets and brands that continue to strengthen the league’s presence and expand its fan base throughout the country.

The return of NFL regular-season games to Mexico adds to the league’s history at Estadio Banorte, which has hosted five NFL regular-season games, previously played in 2005, 2016, 2017, 2019, and 2022.

For more information, visit:

Contacts

Paulette Olivera
Account Manager, Consumer Engagement & Influence, Burson Mexico
paulette.oliveragu@bursonglobal.com | +52 55 8485 8122

Adrian Godoy
International Communications Manager, NFL
adrian.godoy@nfl.com | +1 917 751 4295
        

The Jets will use Paylocity to manage HR, payroll and spend through one platform

SCHAUMBURG, Ill., Sept. 10, 2026 (GLOBE NEWSWIRE) — Paylocity (NASDAQ: PCTY), a leading provider of HCM, Finance, and IT solutions, today announced the New York Jets selected Paylocity as its HCM solution, naming Paylocity the official HCM platform of the organization.

The New York Jets selected Paylocity for its intuitive user experience, responsive service model, and ability to support its growing workforce during the NFL season. The organization uses Paylocity to manage HR, payroll, and spend management on a single platform.

“We selected Paylocity because we wanted a more connected way to manage HR, payroll and spend across our organization,” said Jeff Fernandez, Senior Vice President, Business Development & Ventures of the New York Jets. “Since implementation, we’ve been able to make large-scale employee updates more easily, prepare for seasonal staffing increases and improve workforce reporting. We’re excited to continue building on that foundation with Paylocity.”

“The New York Jets are an iconic franchise with a strong commitment to their people and organization,” said Allison Windon, Vice President of Marketing for Paylocity. “We’re proud they’ve chosen Paylocity and look forward to supporting their team for years to come.”

Paylocity will also serve as an official partner of the New York Jets.

About Paylocity

Headquartered in Schaumburg, IL, Paylocity (NASDAQ: PCTY) is an award-winning provider of HCM, Finance, and IT software solutions. Paylocity offers one unified, easy-to-use platform that helps businesses across HR, Finance, and IT streamline operations, manage spend and talent, and build culture and connection—with AI embedded directly into everyday workflows to save time, reduce manual effort, and support better decisions. Known for its unique culture and consistently recognized as one of the best places to work, Paylocity accompanies its clients on the journey to create great workplaces and help all employees achieve their best. For more information, visit www.paylocity.com.

About the New York Jets

The New York Jets are a professional American football team competing in the National Football League’s American Football Conference East division. Established in 1960, the franchise plays its home games at MetLife Stadium in East Rutherford, New Jersey, and operates its headquarters and training facility at the Atlantic Health Jets Training Center in Florham Park, New Jersey. For more information, visit www.newyorkjets.com.

CONTACT: 
Nicole Andergard Reddy
nreddy@paylocity.com
503-855-7385

Privacy Overview

This website uses cookies so that we can provide you with the best user experience possible. Cookie information is stored in your browser and performs functions such as recognising you when you return to our website and helping our team to understand which sections of the website you find most interesting and useful.