Vancouver, BC, Sept. 21, 2026 (GLOBE NEWSWIRE) — Trident Resources Corp. (TSXV: ROCK) (OTCQB: TRDTF) (Frankfurt: 6BP0) (“Trident” or the “Company”) is pleased to announce that, further to its news release dated July 14th, 2026, it has closed the option agreement dated July 13th, 2026 (the “Agreement”) with Apogee Minerals Ltd. (“Apogee”), an arm’s length party, pursuant to which Apogee may earn a 100% interest in Trident’s Knife Lake Copper Project located in Saskatchewan (the “Property”).

Location Map of Knife Lake Project:
https://www.tridentresourcescorp.com/projects/knife-lake-project/#&gid=1&pid=2

Agreement Terms:

Under the terms of the Agreement, Apogee may earn a 100% interest in the Property by satisfying the cash payment, share issuance and exploration expenditure commitments set out below.

Date Cash Payment Apogee Share Issuance Exploration Expenditures
On the Closing Date $100,000 7,400,000 Shares —
On or before the first anniversary of the Closing Date $150,000 Shares having a deemed value of $350,000(1) Minimum $500,000
On or before the second anniversary of the Closing Date $150,000 Shares having a deemed value of $350,000(1) Additional $500,000
Total $400,000 7,400,000 Shares plus Shares having a deemed value of $700,000(1) $1,000,000

(1) The number of Shares issued for the first and second anniversary payments will be determined using the greater of $0.09 per Share and the 10-day volume weighted average closing price of the Shares on the TSX Venture Exchange at the applicable time. 

The Agreement also contains customary provisions limiting Trident’s ownership to below 10% of Apogee’s outstanding shares and preventing Trident from becoming a reporting insider of Apogee, with any excess consideration payable in cash. Apogee will act as operator on the Property during the option period, may accelerate the exercise of the option at any time by completing the required payments and exploration expenditures, and may elect to satisfy any portion of the required exploration expenditures in cash. All securities issued pursuant to the Agreement will be subject to a statutory hold period of four months and one day from the date of issuance in accordance with applicable Canadian securities laws. No finder’s fees were paid in connection with the Transaction.

Upon exercise of the Option, Apogee will hold a 100% interest in the Property, subject to existing underlying royalties consisting of a 2.5% net smelter returns (“NSR”) royalty payable to Summit Royalties Ltd. and a 1.5% NSR royalty payable to a private individual on certain mineral claims comprising the Property (collectively, the “Underlying NSR Royalties”).

Marketing Engagement:

Trident also announces it has entered into a media services contract (the “FFR Agreement”) with Freedom Financial Research, LLC (“FFR”). Pursuant to the terms of the FFR Agreement, FFR will, among other items, provide the Company with marketing services, which includes social media management, content creation, distribution, digital marketing, and any other marketing services as agreed upon by the Company and FFR (the “FFR Services”) for distribution by email. The FFR Agreement has a term of 30 days, commencing upon launch today on September 21st. The Company will make a one-time payment to FFR of US$150,000 as consideration for the Services and FFR may be contact at support@freedomfinancialresearch.com. The Company will not issue any securities to FFR as compensation. Both Christopher Carroll and FFR are arm’s length to the Company and do not have any interest, direct or indirect, in the Company or its securities nor do they have any right to acquire such an interest.

Qualified Person:

The technical information in this news release has been prepared in accordance with the Canadian regulatory requirements set out in National Instrument 43-101 and reviewed and approved by Cornell McDowell, P.Geo., VP Exploration for Trident Resources and the Qualified Person for Trident as defined by NI 43-101.

About Trident Resources Corp.

Trident Resources Corp. is a Canadian gold exploration company focused on advancing district-scale opportunities in Saskatchewan’s La Ronge Gold Belt. The Company has assembled a large and strategic land position encompassing the several gold projects, which host foundational gold resources, together with a growing portfolio of highly prospective regional exploration properties. 

Trident’s current exploration focus is at the 100%-owned Contact Lake Gold Project, host to a past-producing high-grade gold mine where active drill programs are underway to expand known mineralization and unlock the broader district-scale potential of the belt. Backed by a strong treasury as well as an experienced technical and capital markets team, Trident is advancing multiple opportunities with the goal of becoming a leading explorer in one of Canada’s emerging gold districts

To find out more about Trident Resources Corp. (TSX-V: ROCK) visit the Company’s website at www.tridentresourcescorp.com.

TRIDENT RESOURCES CORP.

“Jonathan Wiesblatt”
                                                                               
Jonathan Wiesblatt
CEO and Director

For further information, please contact:

Jonathan Wiesblatt, Chief Executive Officer
Email: Jon.Wiesblatt@tridentresourcescorp.com

Or:

Lubica Keighery, Corporate Communications
Email: lubica.keighery@tridentresourcescorp.com

Trident Resources Corp.
Telephone: 778-889-5476
Toll Free: 800-567-8181
Facsimile: 604-687-3119

NEITHER THE TSX VENTURE EXCHANGE NOR ITS REGULATION SERVICES PROVIDER ACCEPTS RESPONSIBILITY FOR THE ADEQUACY OR ACCURACY OF THE CONTENT OF THIS NEWS RELEASE.

Forward-Looking Information

This news release contains “forward‐looking information or statements” within the meaning of applicable securities laws, which may include, without limitation, statements regarding the timing and satisfaction of future Option Payments and exploration expenditure commitments under the Agreement, completing ongoing and planned work on its projects including drilling and the expected timing of such work programs, other statements relating to the technical, financial and business prospects of the Company, its projects and other matters. All statements in this news release, other than statements of historical facts, that address events or developments that the Company expects to occur, are forward-looking statements. Although the Company believes the expectations expressed in such forward-looking statements are based on reasonable assumptions, such statements are not guarantees of future performance and actual results may differ materially from those in the forward-looking statements. Such statements and information are based on numerous assumptions regarding present and future business strategies and the environment in which the Company will operate in the future, including the price of gold, copper and other metals, the ability to achieve its goals, that general business and economic conditions will not change in a material adverse manner, that financing will be available if and when needed and on reasonable terms. Such forward-looking information reflects the Company’s views with respect to future events and is subject to risks, uncertainties and assumptions, including the risks and uncertainties relating to the interpretation of exploration results, risks related to the inherent uncertainty of exploration and cost estimates and the potential for unexpected costs and expenses, and those filed under the Company’s profile on SEDAR+ at www.sedarplus.ca. Factors that could cause actual results to differ materially from those in forward looking statements include, but are not limited to, continued availability of capital and financing and general economic, market or business conditions, adverse weather or climate conditions, failure to obtain or maintain all necessary government permits, approvals and authorizations, failure to obtain or maintain community acceptance (including First Nations), decrease in the price of gold, copper and other metals, increase in costs, litigation, and failure of counterparties to perform their contractual obligations. The Company does not undertake to update forward‐looking statements or forward‐looking information, except as required by law.

Drilling through the eastern margin of the Kerr Open Pit and east of the 2026 Mineral Resource Estimate pit has defined mineralization from near surface to 300 metres depth in an area with limited previous drilling, strongly supporting an eastward extension of the open pit

TORONTO, Ontario, Sept. 21, 2026 (GLOBE NEWSWIRE) — Cadillac Mines Corporation (TSX: CADY), (“Cadillac Mines” or the “Company“) is pleased to announce assay results from expansion diamond drilling at the Chesterville East Extension (“CVE”) at Kerr-Addison (“KA”), located in Virginiatown, Ontario. Results are reported for a total of 68 drill holes from an ongoing property-wide infill and expansion diamond drill program.

Today’s release includes assay results from 68 drill holes totaling 28,304 metres of a planned 30,500 metres of expansion drilling at CVE, east of the former Chesterville Mine and the 2026 Mineral Resource Estimate (“MRE”) resource pit. All assay results reported in this release were received after the cut-off date for the 2026 MRE and were not used in that mineral resource estimate.

Chesterville East Extension Drilling Highlights

Selected highlight results include:

  • 1.36 g/t Au over 4.8 m estimated true width (ETW) in hole KAD26-407
  • 1.35 g/t Au over 5.2 m estimated true width (ETW) in hole KAD26-415
  • 1.28 g/t Au over 10.1 m estimated true width (ETW) in hole KAD26-507
  • 2.29 g/t Au over 3.2 m estimated true width (ETW) in hole KAD26-404
  • 2.44 g/t Au over 7.5 m estimated true width (ETW), and 3.21 g/t Au over 3.4 m (ETW) in hole KAD26-473
  • 1.50 g/t Au over 14.4 m estimated true width (ETW) in hole KAD26-442
  • 1.33 g/t Au over 8.8 m estimated true width (ETW) in hole KAD26-433
  • 2.02 g/t Au over 5.6 m estimated true width (ETW) in hole KAD26-501

Rick Howes, Chief Executive Officer of Cadillac Mines, stated, “These results open up an area east of the 2026 MRE resource pit that had seen very little drilling previously, clearly demonstrating that the mineralization defined within the Kerr Open Pit continues well beyond the pits eastern limit.” Mr. Howes continued, “This new mineralization is in an area that is not within our current mineral resource, and with continued drilling gives us a real opportunity to grow the Kerr open pit.”

Geology and Context of Results

The Kerr-Addison Deposit is an Archean orogenic gold system located in the Abitibi Greenstone Belt. It is spatially associated with the Larder Lake Cadillac Deformation Zone (LLCDZ), a major crustal fault that acted as a conduit for hydrothermal fluids and controlled the emplacement of gold mineralization. The Kerr Fault, a steeply north dipping subsidiary splay of the LLCDZ, strikes eastward across the property and is taken as the boundary between the hangingwall to the north and the footwall panels to the south. There are five main mineralized domains that host the Kerr mineralization: Green Carbonate and Flow domains, which constitute the Main Break mineralization that accounted for over 10 million ounces of historical gold production, and the Footwall (Chesterville or CVE), Albitic and Graphitic domains which accounted for under 0.5 Moz of historic production.

The holes highlighted in this news release were drilled east of the former Chesterville Mine, targeting the eastward continuation of the footwall panels in an area that had seen very little previous drilling. Drilling in this target area began in the fourth quarter of 2025 and the initial results made this a focus of the 2026 program. These results demonstrate that the mineralization continues east of the former Chesterville workings, from within the eastern margin of the 2026 MRE resource pit to approximately 350 metres east of it, and that mineralization is present through the full vertical section on the eastern margin. Of the 68 holes drilled, 61 returned composites above the 2026 MRE cutoff grade. Most of the intersections highlighted are in areas not modelled as mineralized in the 2026 MRE and are presented from furthest east and moving west towards the edge of the 2026 MRE resource pit.

  • Holes KAD26-407, KAD26-415 and KAD26-507 (Figures 1, 3 & 4) on section B-B’ were drilled approximately 350 metres east of the 2026 MRE resource pit, in an area not modelled in the 2026 MRE. All three holes intersected footwall mineralization adjacent to the Kerr Fault at grades comparable to the open pit resource, approximately 260 metres below surface, indicating the footwall mineralization continues east of the Chesterville workings. KAD26-415 also intersected mineralization approximately 80 metres below surface over good width, at a grade below the open pit resource average but well above cut-off, in what is interpreted as a separate panel further south within the footwall.
  • On section B-B’, hole KAD26-404 (Figures 1, 3 & 4) intersected hangingwall mineralization approximately 225 metres below surface at well above the open pit resource grade. This area was not modelled in the 2026 MRE, and the result confirms vertical continuity to 250 m below surface of hangingwall mineralization between the Kerr Fault and the LLCDZ.
  • Hole KAD26-473 (Figures 1, 3 & 5) was drilled on section C-C’ approximately 125 metres east of the 2026 MRE resource pit. The hole returned two intersections on separate footwall panels, both in ground not modelled as mineralized in the 2026 MRE, which is present on this section only as a narrow shallow tail. The upper intersection, 2.44 g/t Au over 7.5 m (ETW), sits approximately 100 metres below surface at close to double the open pit resource average grade, immediately below an area modelled as Mineralization Potential. The lower intersection, 3.21 g/t Au over 3.4 m (ETW), sits approximately 140 metres below surface at more than double the open pit resource average grade, over roughly half the width of the upper intersection and adjacent to inferred material carried in the 2026 MRE to the south. Both intersections sit at shallow depth at grades well above the open pit resource average, east of the current pit limit.
  • Holes KAD26-442 and KAD26-433 (Figures 1, 3 & 5) were drilled approximately 315 metres east of the 2026 MRE resource pit, testing the footwall domain approximately 300 metres below surface and well beyond the eastern limit of the pit. Both drill holes returned intersections at grades approximately equal to the open pit resource average, in an area not modelled as mineralized in the 2026 MRE and adjacent to volumes modelled as Mineralization Potential. Taken together these two holes define a single wide mineralized panel at this depth and demonstrate that the footwall mineralization continues east of the current pit limit.
  • Hole KAD26-501 (Figures 1, 3 & 6) is the westernmost of the holes highlighted in this news release, approximately 60 metres east of the former Chesterville underground workings. The hole returned 2.02 g/t Au over 5.6 m (ETW) at a grade considerably above the open pit resource average, approximately 300 metres below surface and immediately adjacent to the Kerr Fault. The intersection sits roughly 25 metres below the eastern edge of the 2026 MRE resource pit, in ground not modelled as mineralized in that estimate, and above inferred blocks modelled in the 2026 MRE. The result demonstrates potential to deepen the pit along its eastern margin, where a revised pit shell could also capture the inferred material below the intersection.

Expansion drilling is continuing at the Chesterville East Extension, both to the east and at depth, and continuing to increase drill density in the area covered by this news release. This program is expected to conclude early in the fourth quarter of 2026.

Figure 1
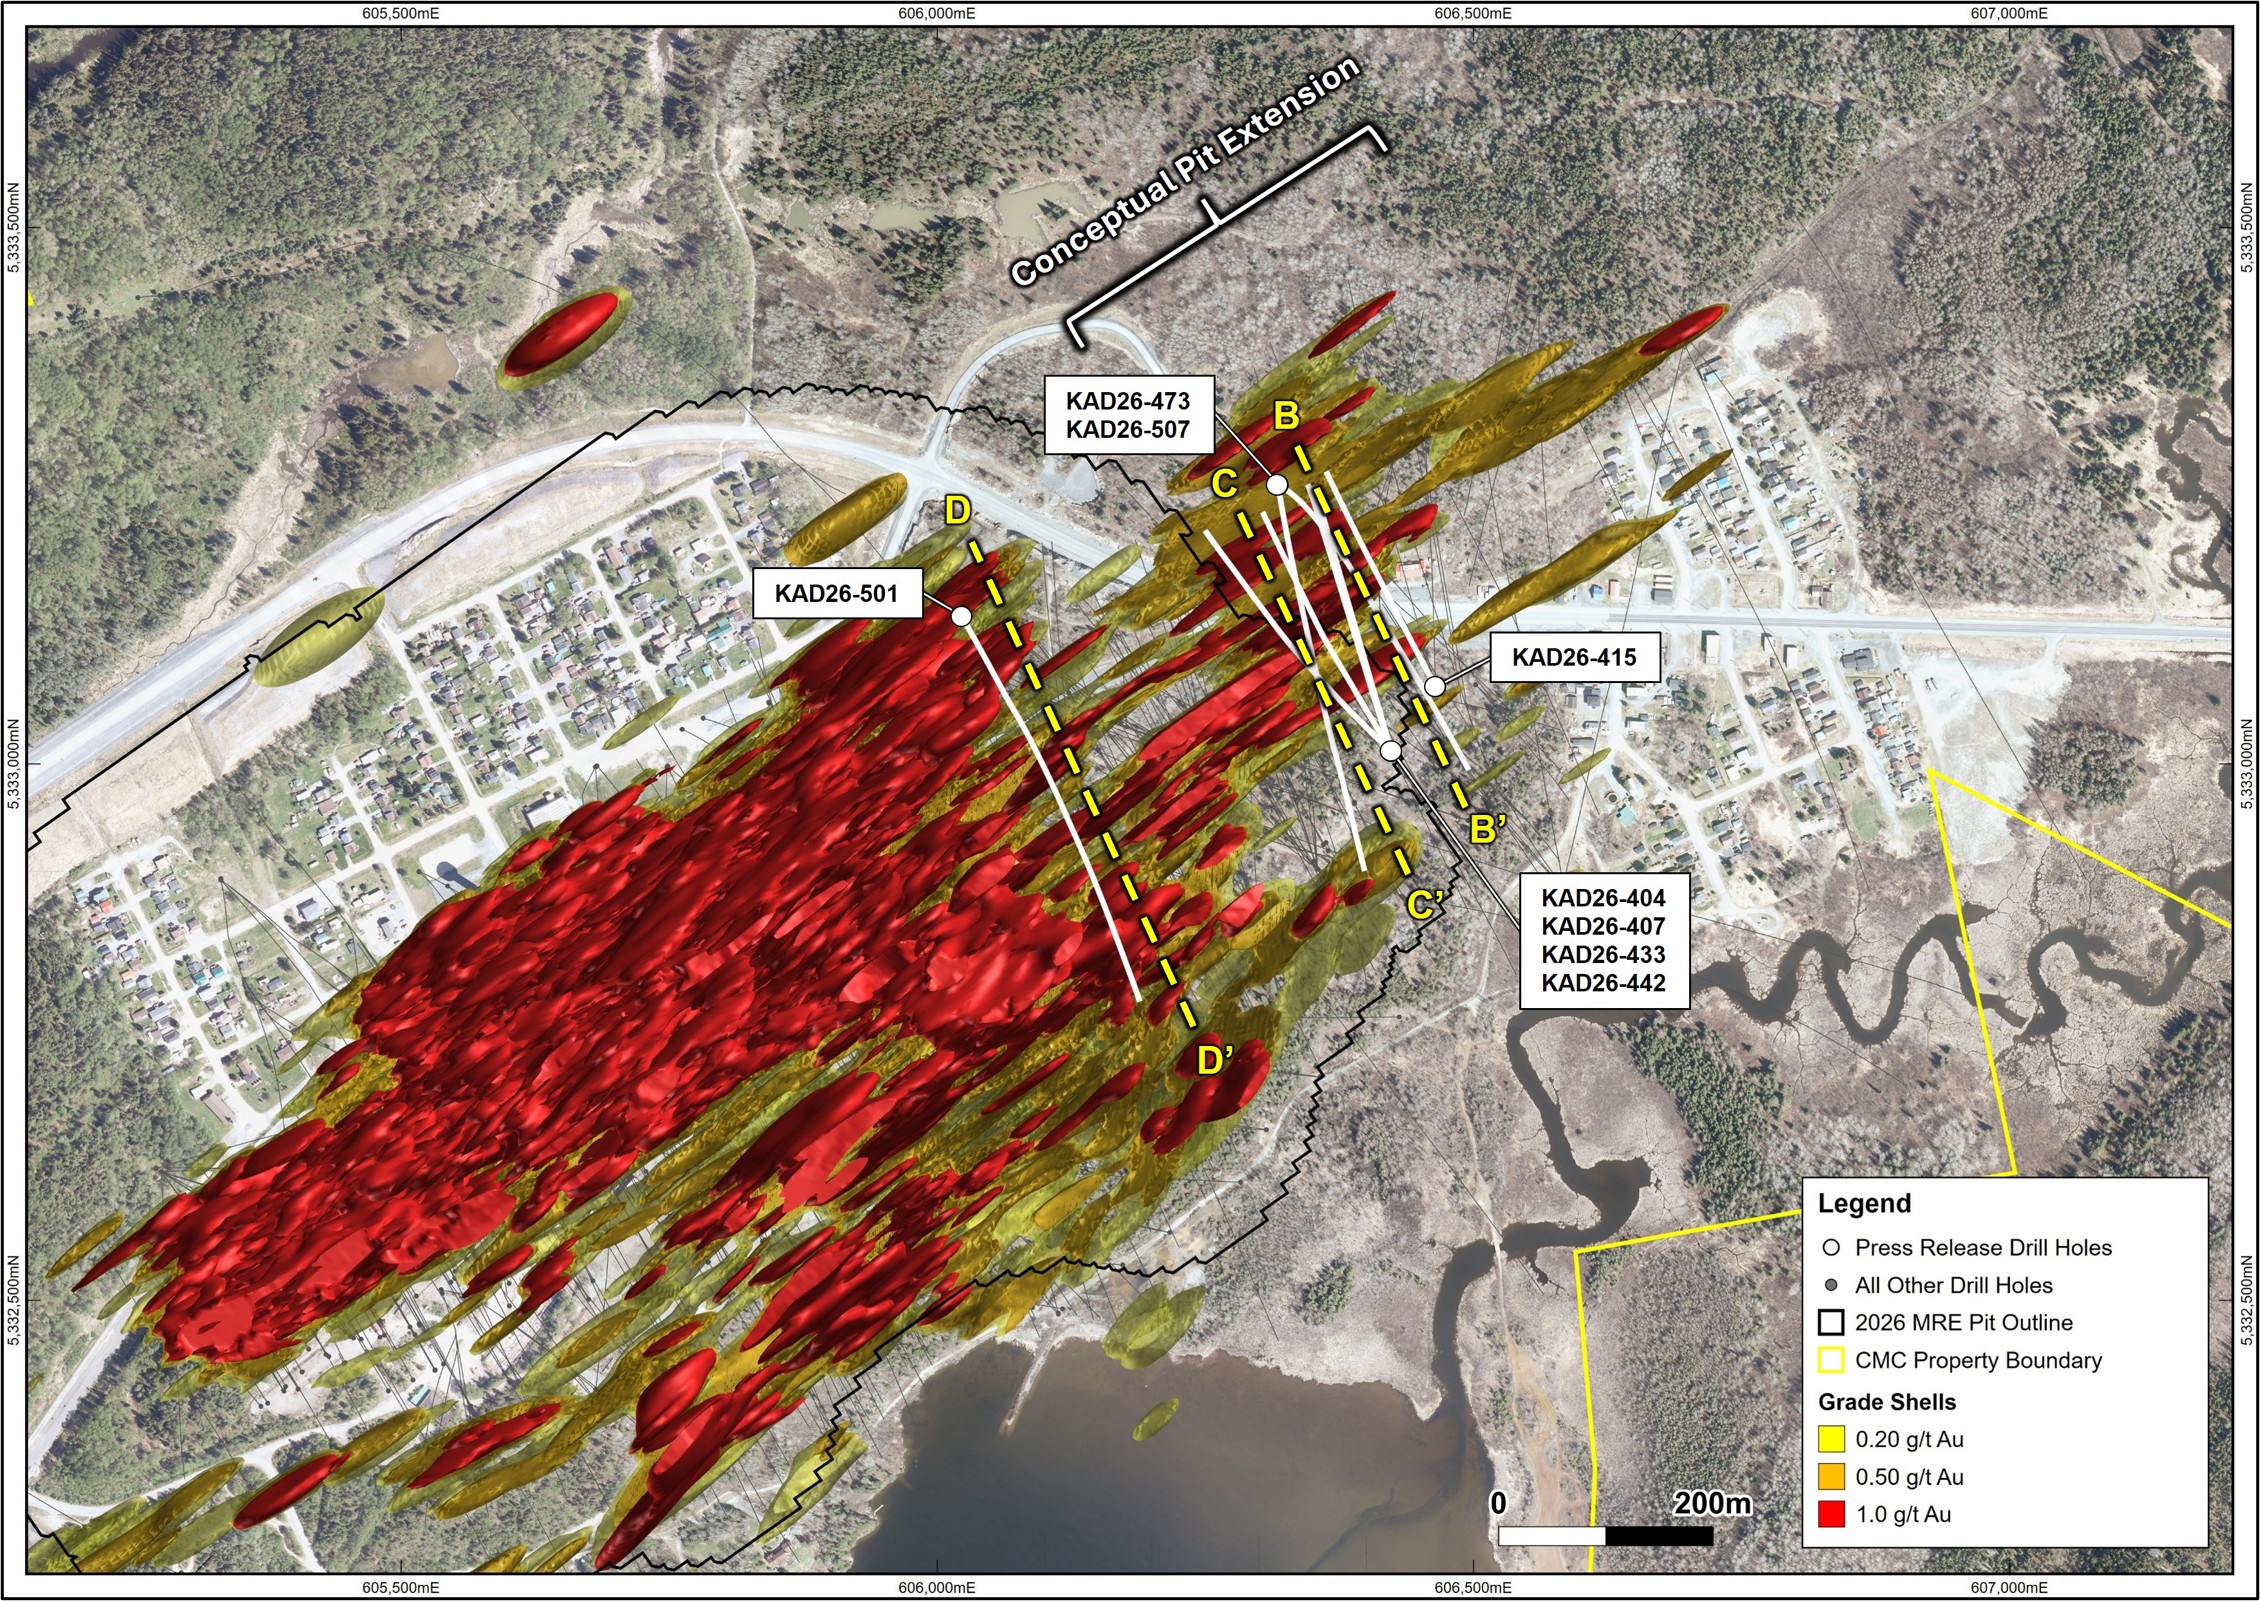
Plan Map of selected highlight drill hole section locations with recently modelled Au grade shells.

Plan Map of selected highlight drill hole section locations with recently modelled Au grade shells.

Figure 2
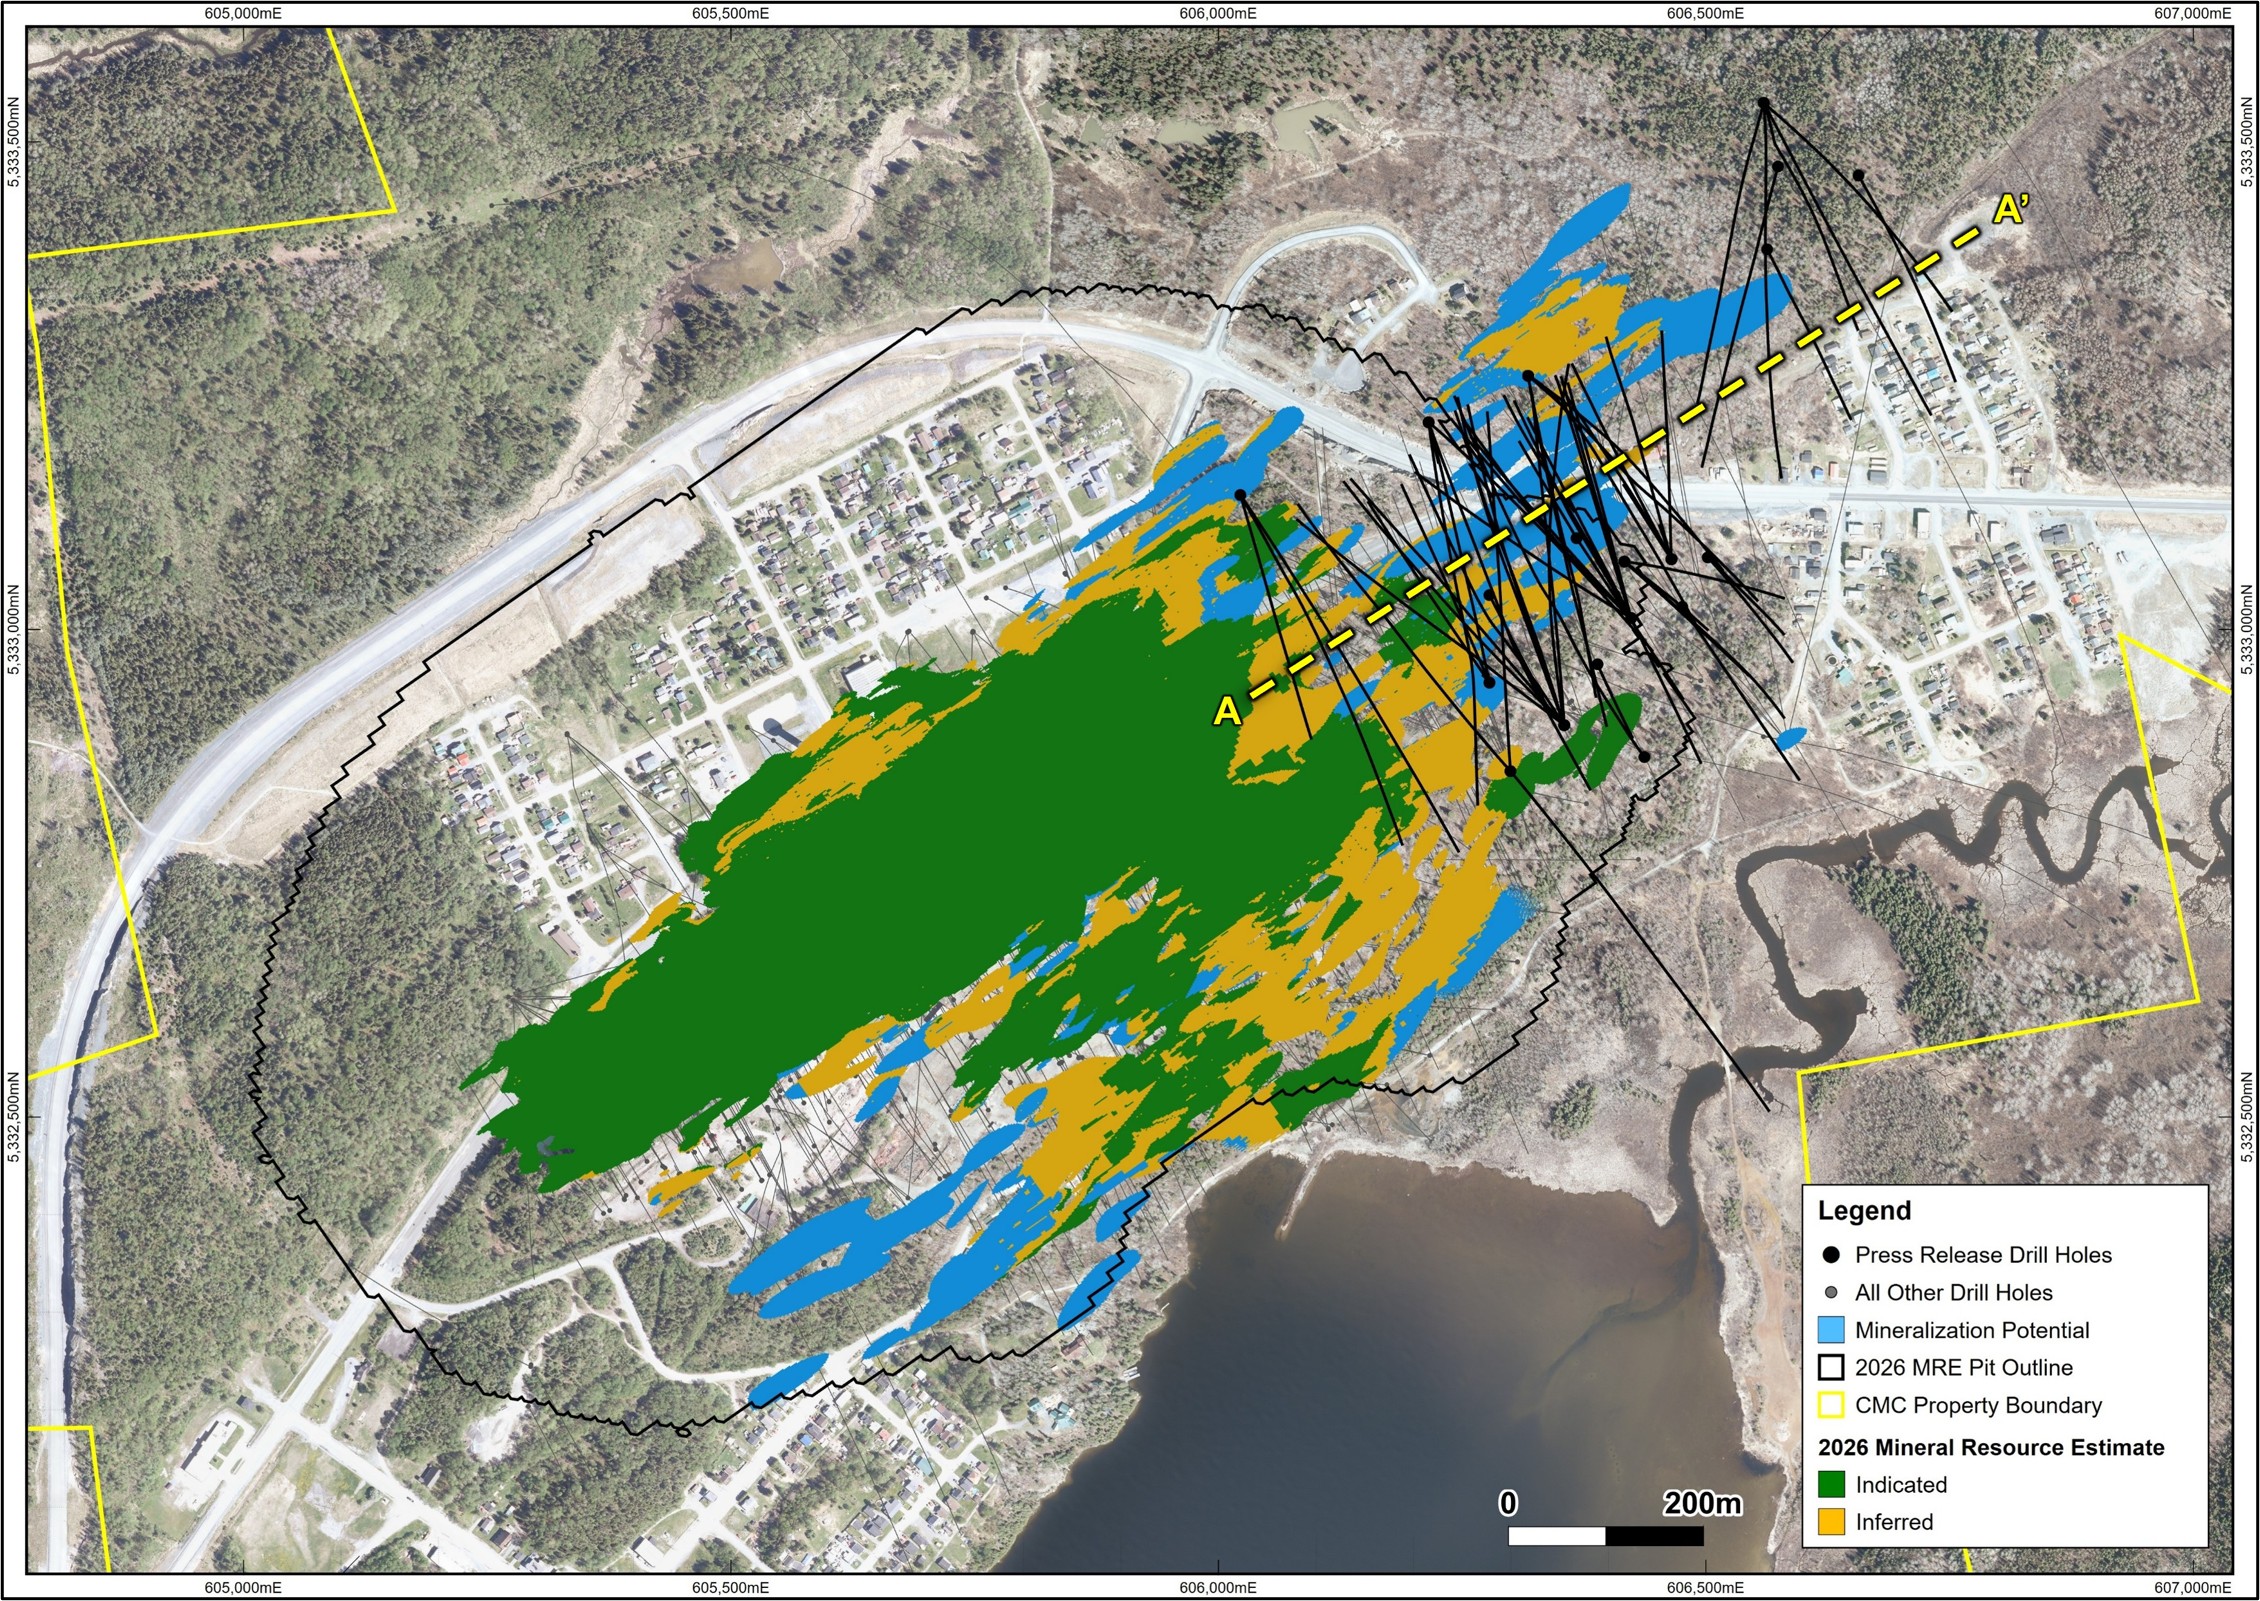
Plan Map of all drill hole locations from this release, surface projection of 2026 Mineral Resource Estimate (MRE) with MRE pit outline at surface and section lines for the A-A' presented in the current release.

Plan Map of all drill hole locations from this release, surface projection of 2026 Mineral Resource Estimate (MRE) with MRE pit outline at surface and section lines for the A-A’ presented in the current release.

Figure 3
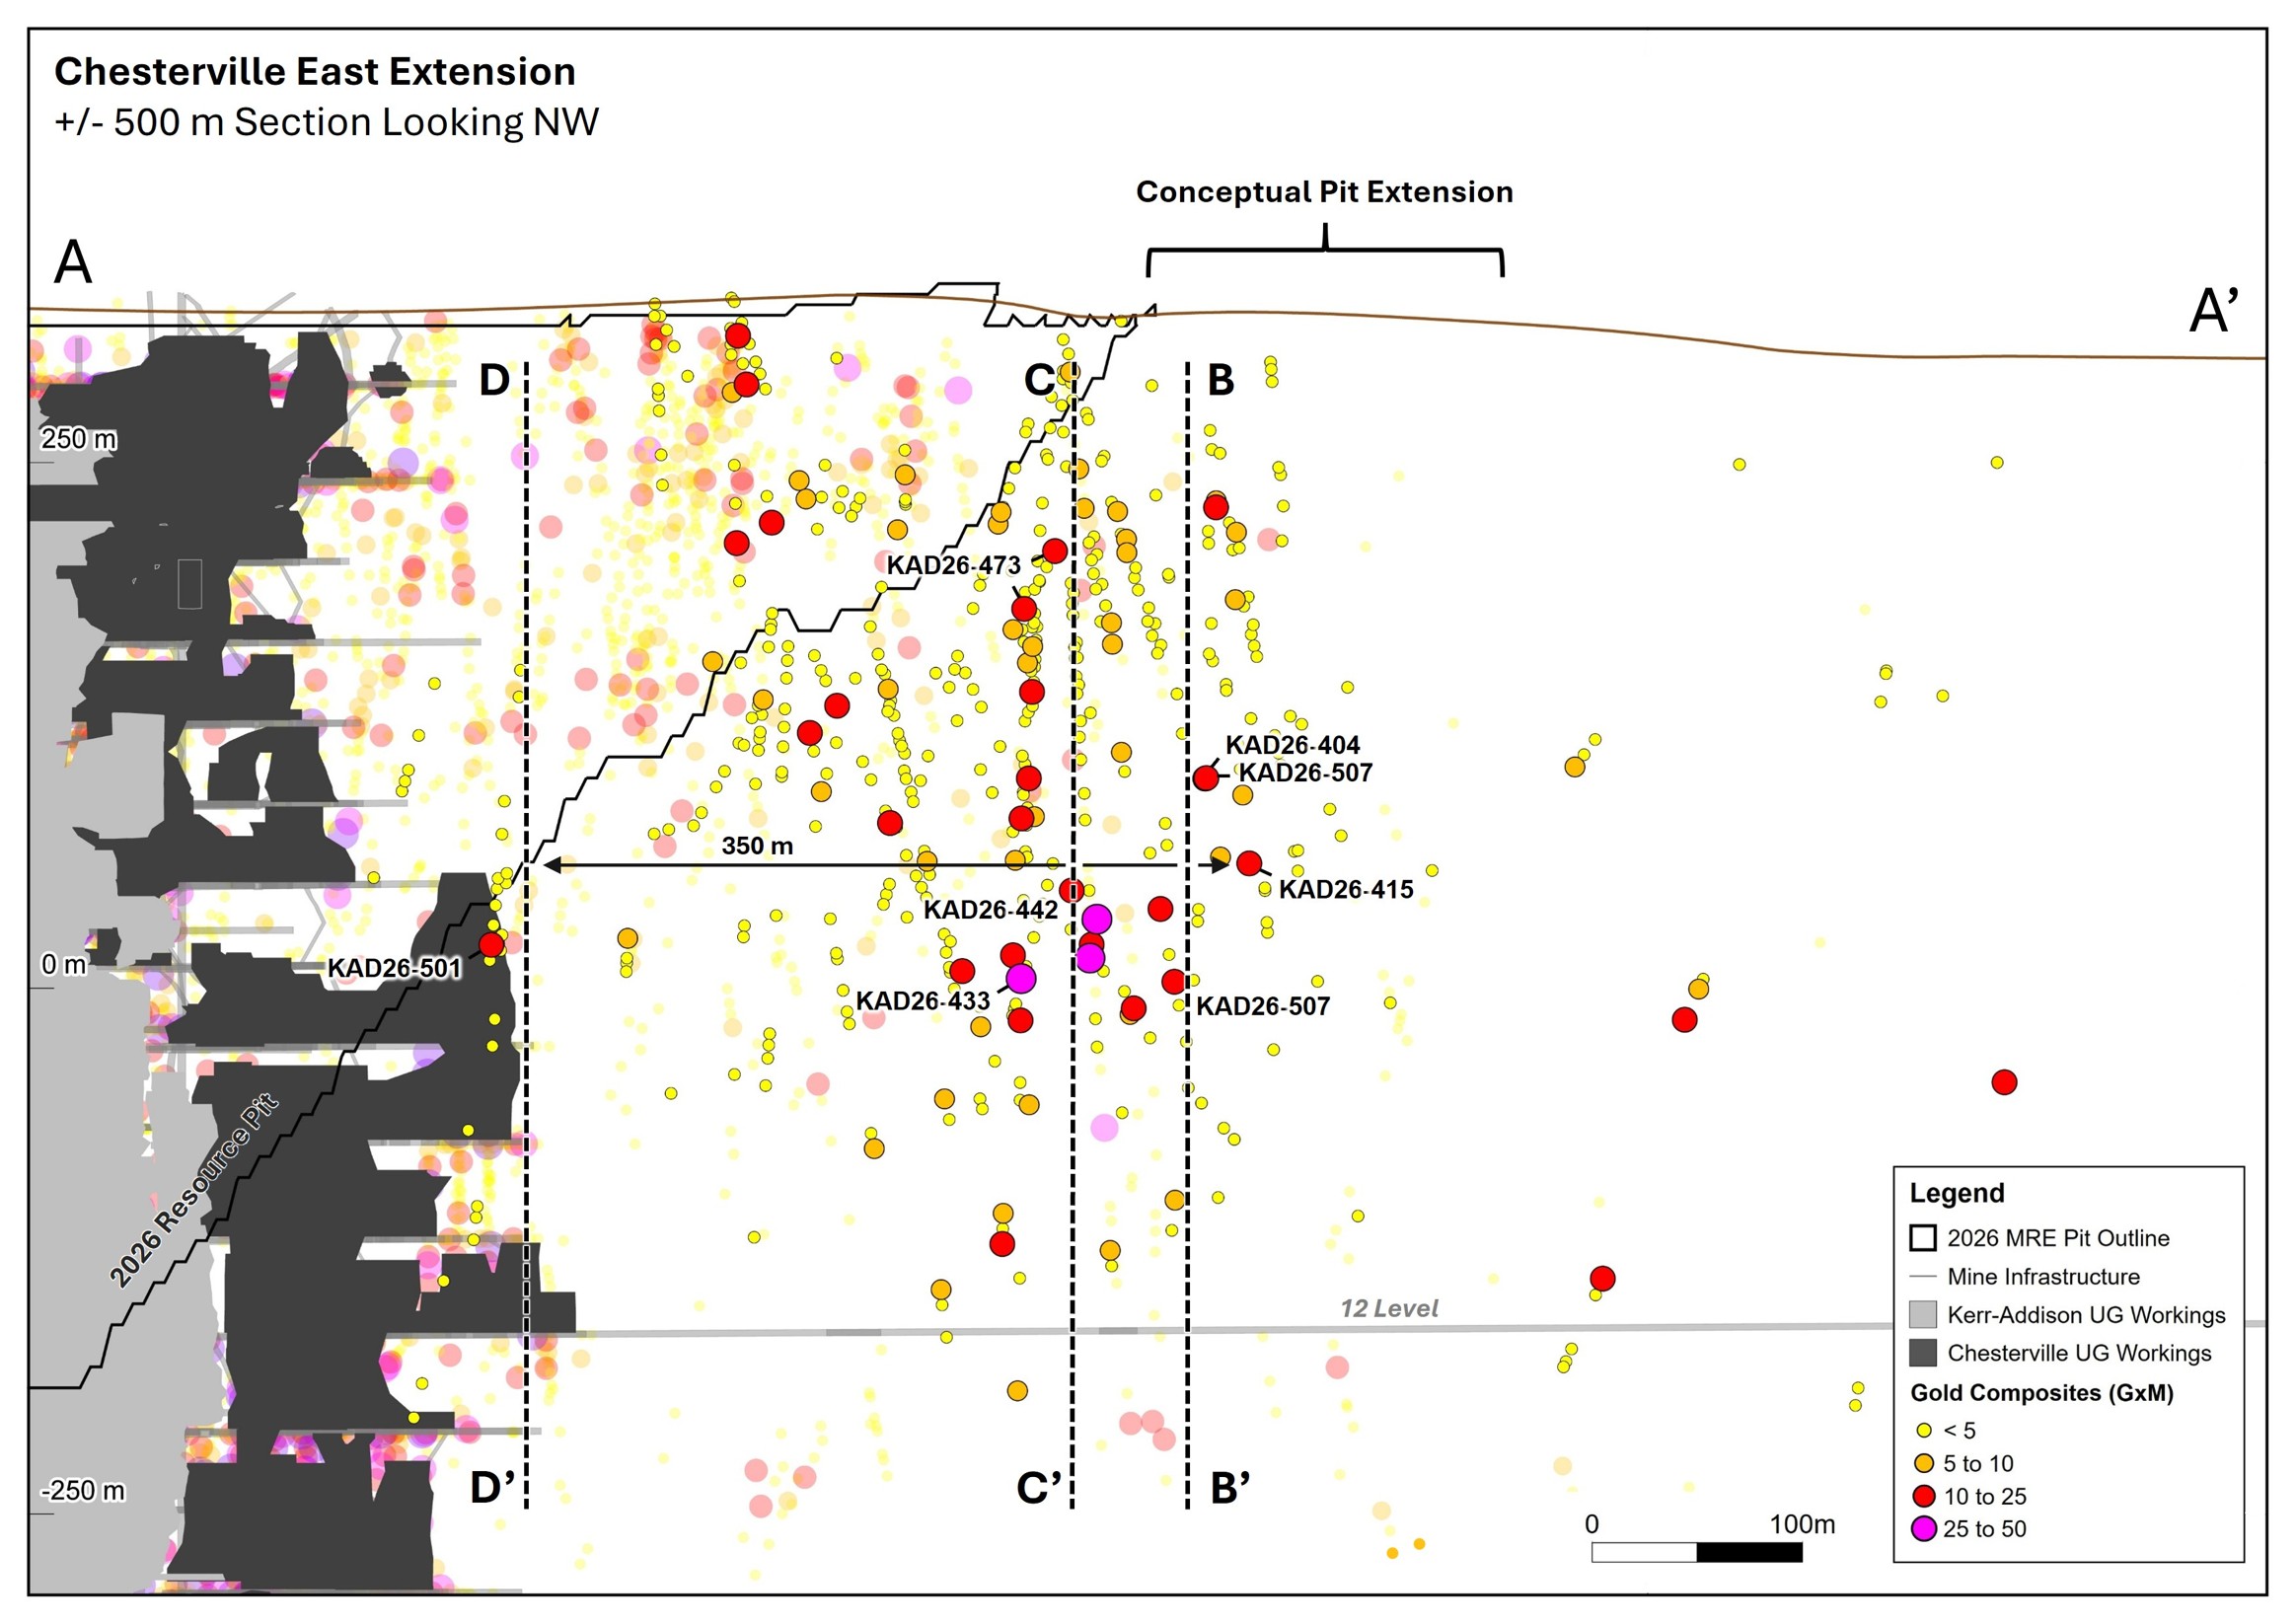
Longitudinal section A-A’ looking northwest, showing all 2026 drill hole intersections from this release in full colour, with black outlines, previous drilling in semi-transparent. Intersections are sized by Au grade multiplied by metres. Intersection points with a black border and label correspond to the selected highlights presented in this release. Previously released and historical drill holes not shown.

Longitudinal section A-A’ looking northwest, showing all 2026 drill hole intersections from this release in full colour, with black outlines, previous drilling in semi-transparent. Intersections are sized by Au grade multiplied by metres. Intersection points with a black border and label correspond to the selected highlights presented in this release. Previously released and historical drill holes not shown.

Figure 4
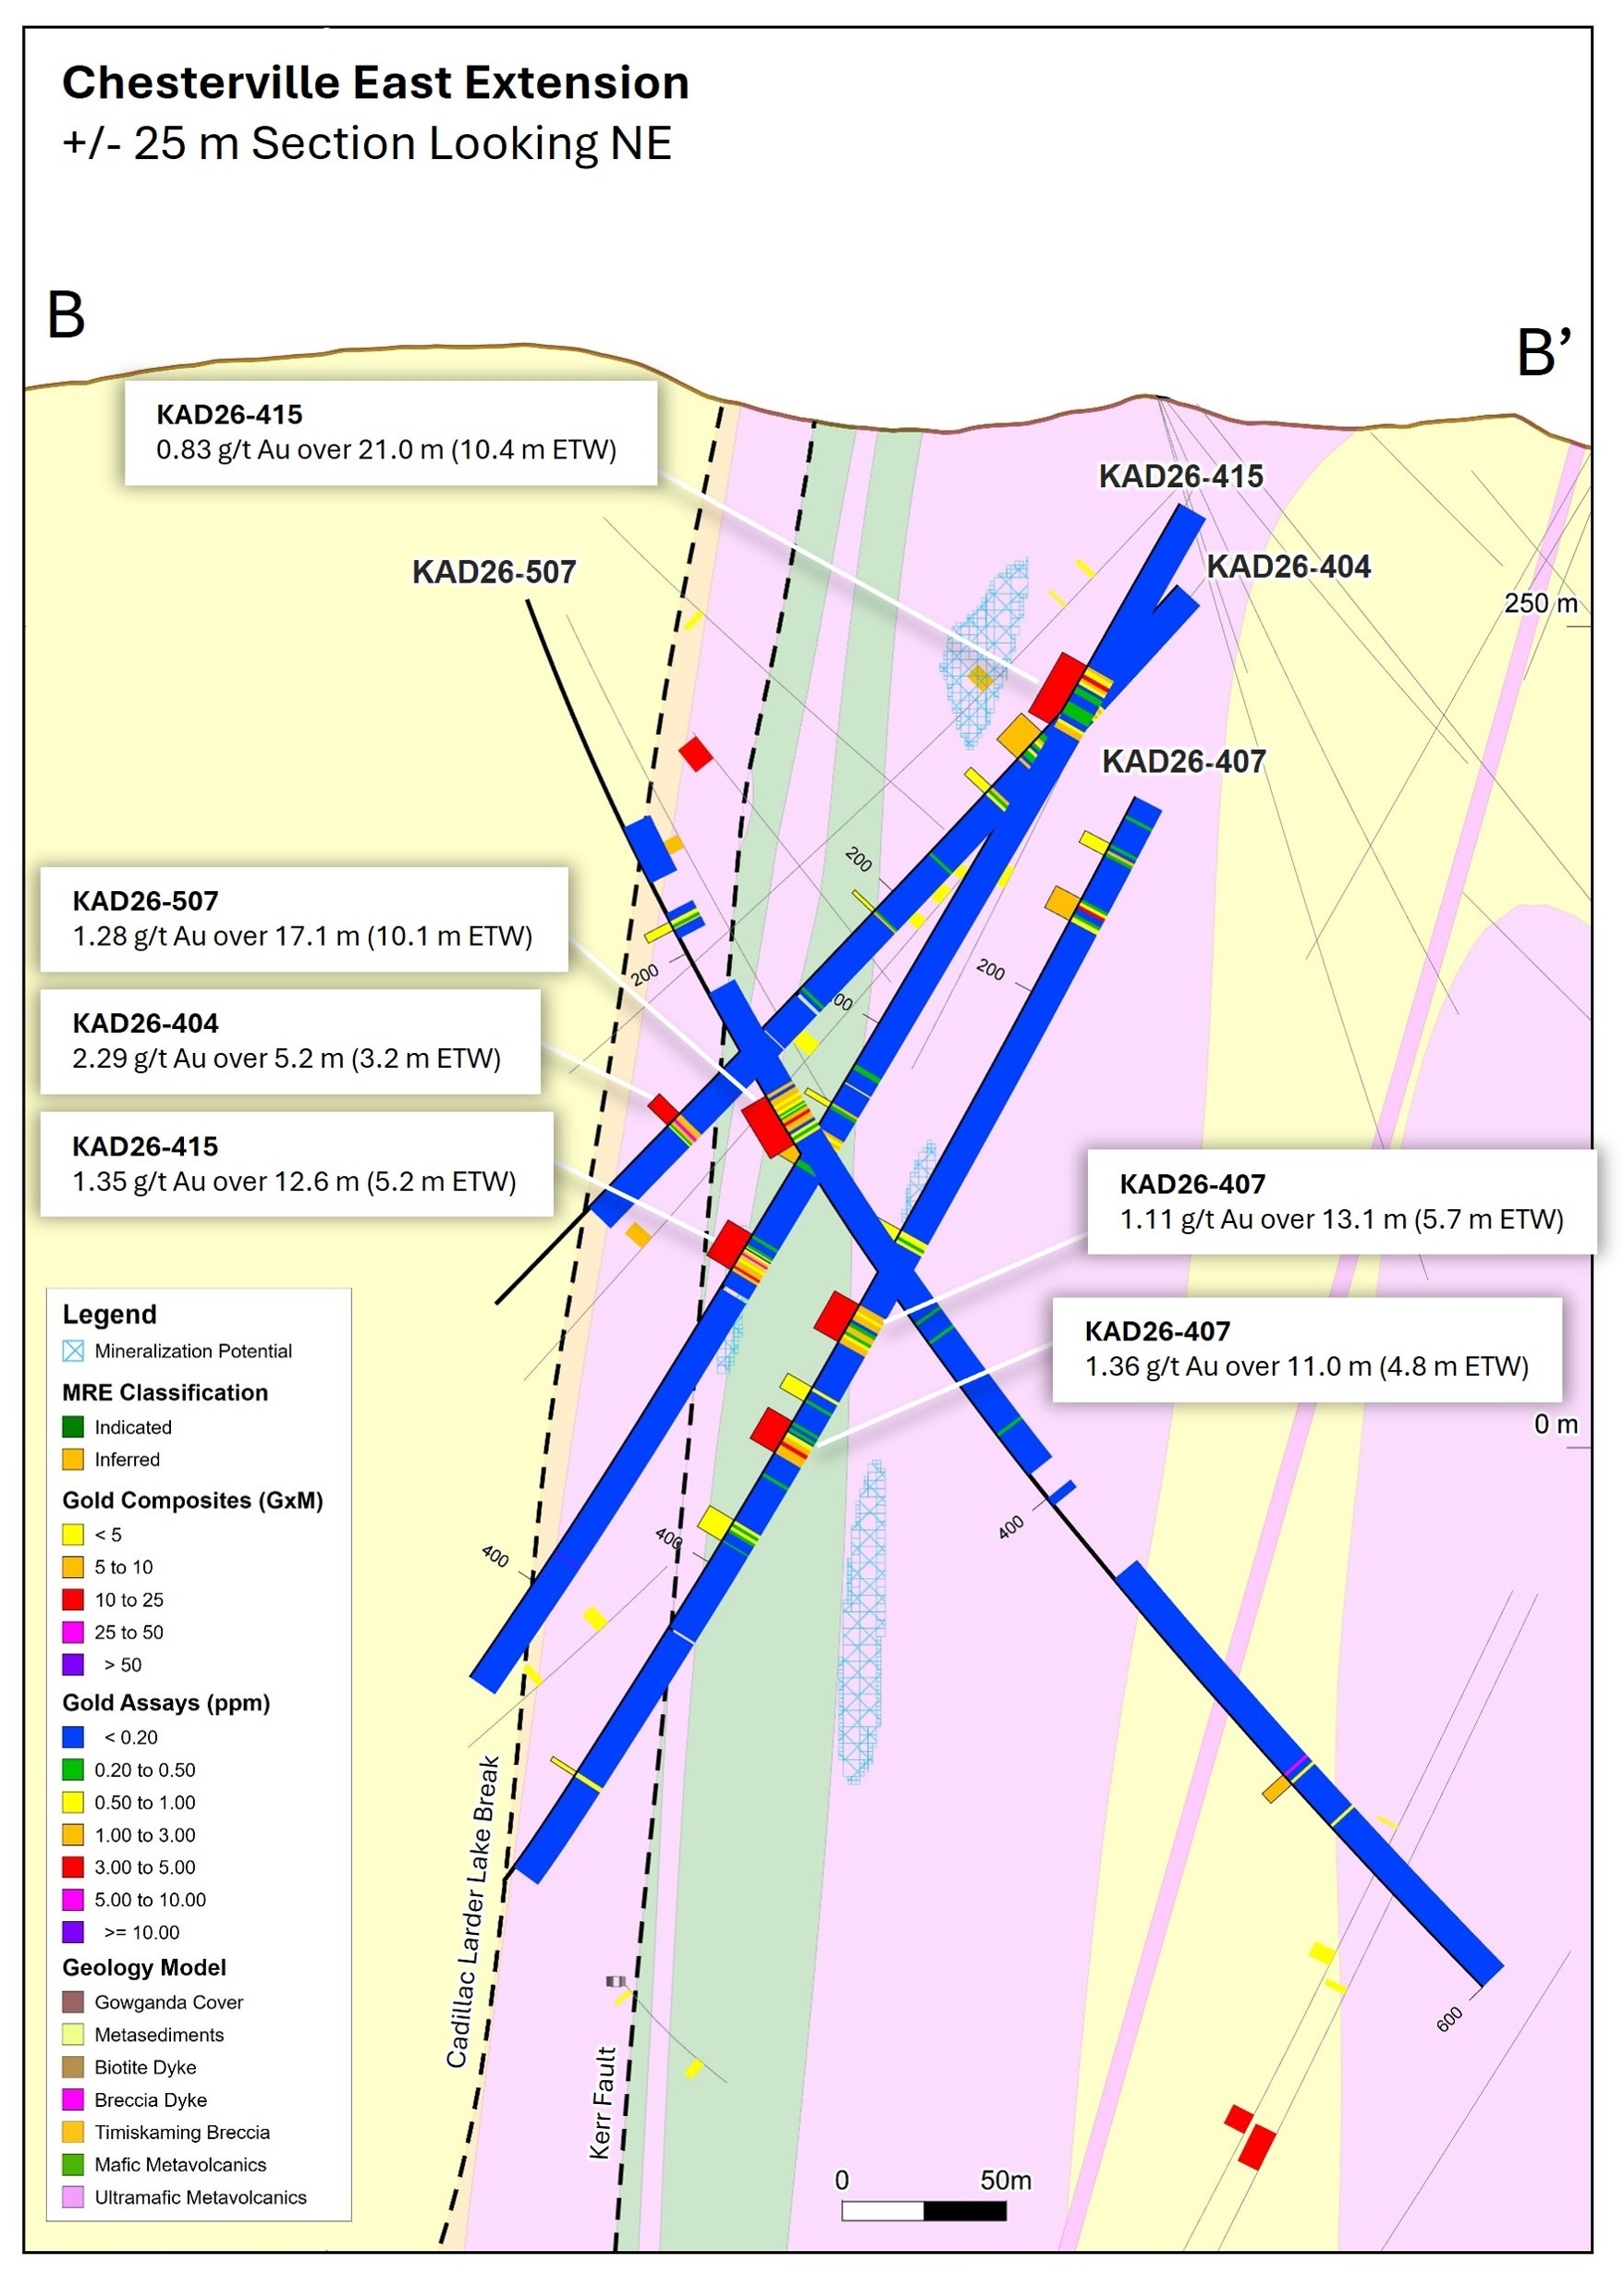
Cross section B-B’ looking northeast, showing drill holes KAD26-404, KAD26-407, KAD26-415 and KAD26-507 with Mineralization Potential. Note that the 2026 MRE Resource Pit Shell does not extend to this section. Previously released and historical drill holes as well as intersections from this release that did not meet the highlight section criteria are shown in grey. Reported intervals are estimated true width (ETW).

Cross section B-B’ looking northeast, showing drill holes KAD26-404, KAD26-407, KAD26-415 and KAD26-507 with Mineralization Potential. Note that the 2026 MRE Resource Pit Shell does not extend to this section. Previously released and historical drill holes as well as intersections from this release that did not meet the highlight section criteria are shown in grey. Reported intervals are estimated true width (ETW).

Figure 5
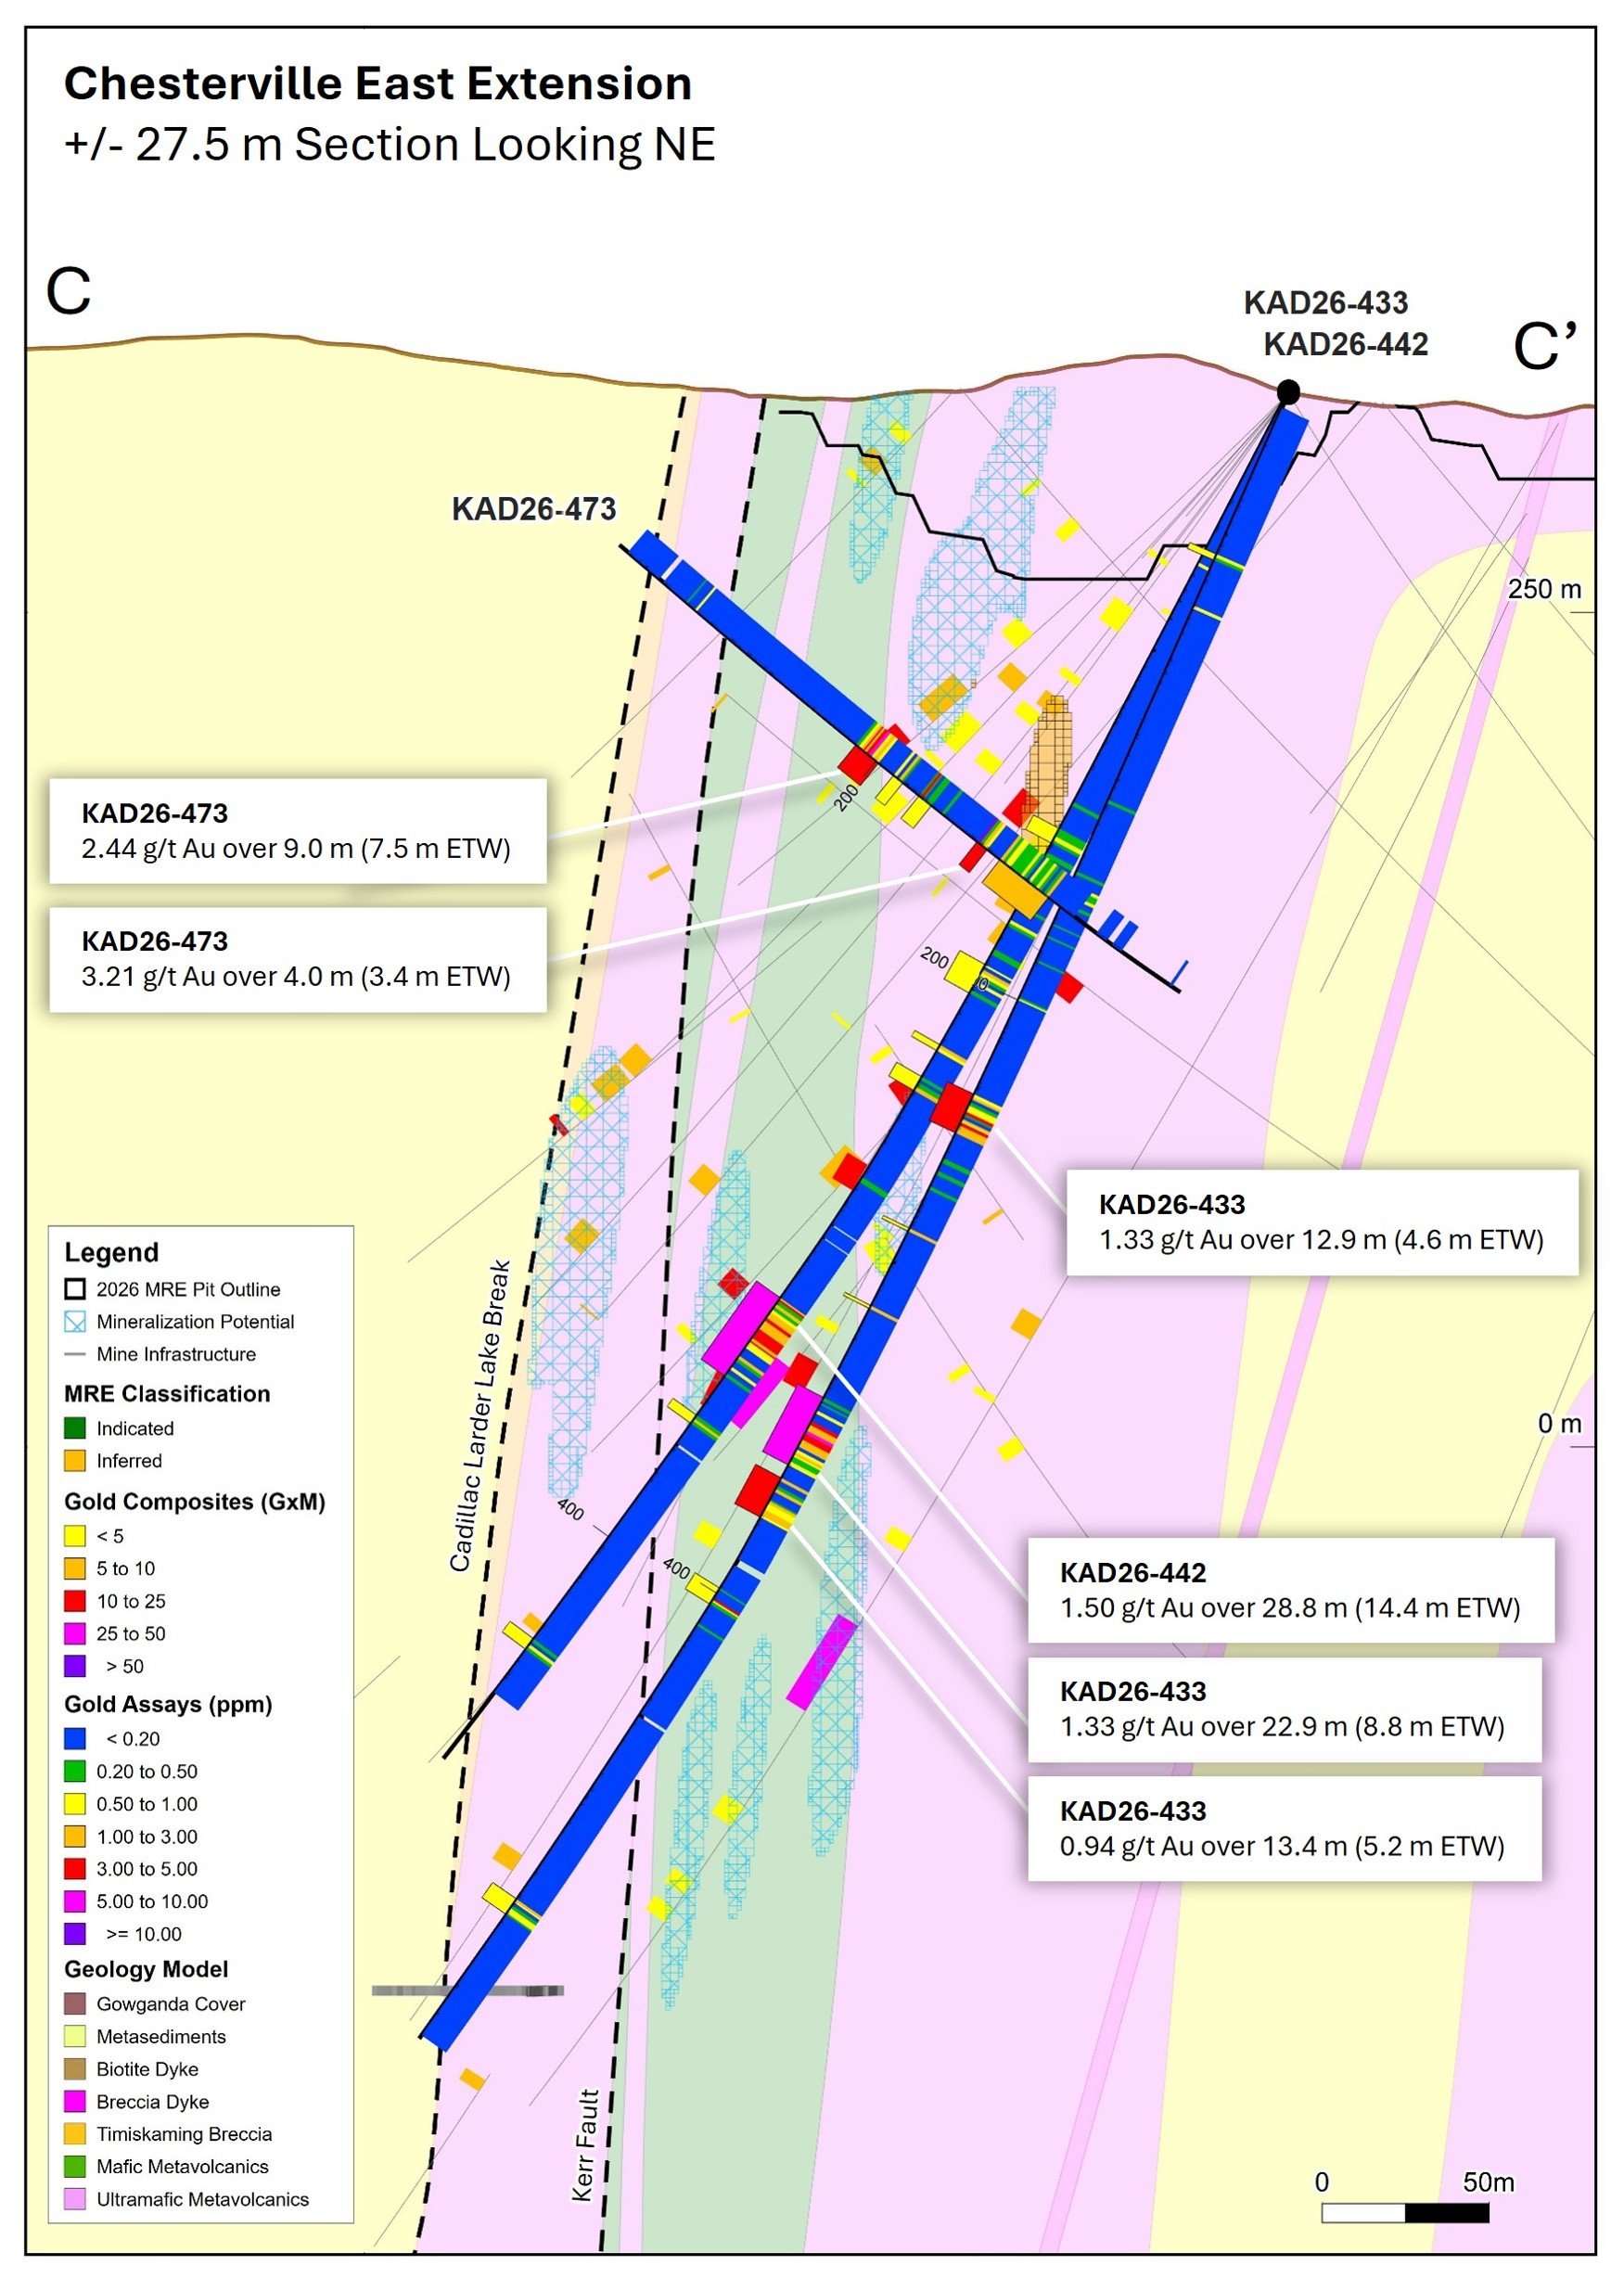
Cross Section C-C’ looking northeast, showing drill holes KAD26-433, KAD26-442, and KAD26-473 with 2026 MRE Block Model, Mineralization Potential and 2026 MRE Resource Pit Shell. Previously released and historical drill holes as well as intersections from this release that did not meet the highlight section criteria are shown in grey. Reported intervals are estimated true width.

Cross Section C-C’ looking northeast, showing drill holes KAD26-433, KAD26-442, and KAD26-473 with 2026 MRE Block Model, Mineralization Potential and 2026 MRE Resource Pit Shell. Previously released and historical drill holes as well as intersections from this release that did not meet the highlight section criteria are shown in grey. Reported intervals are estimated true width.

Figure 6
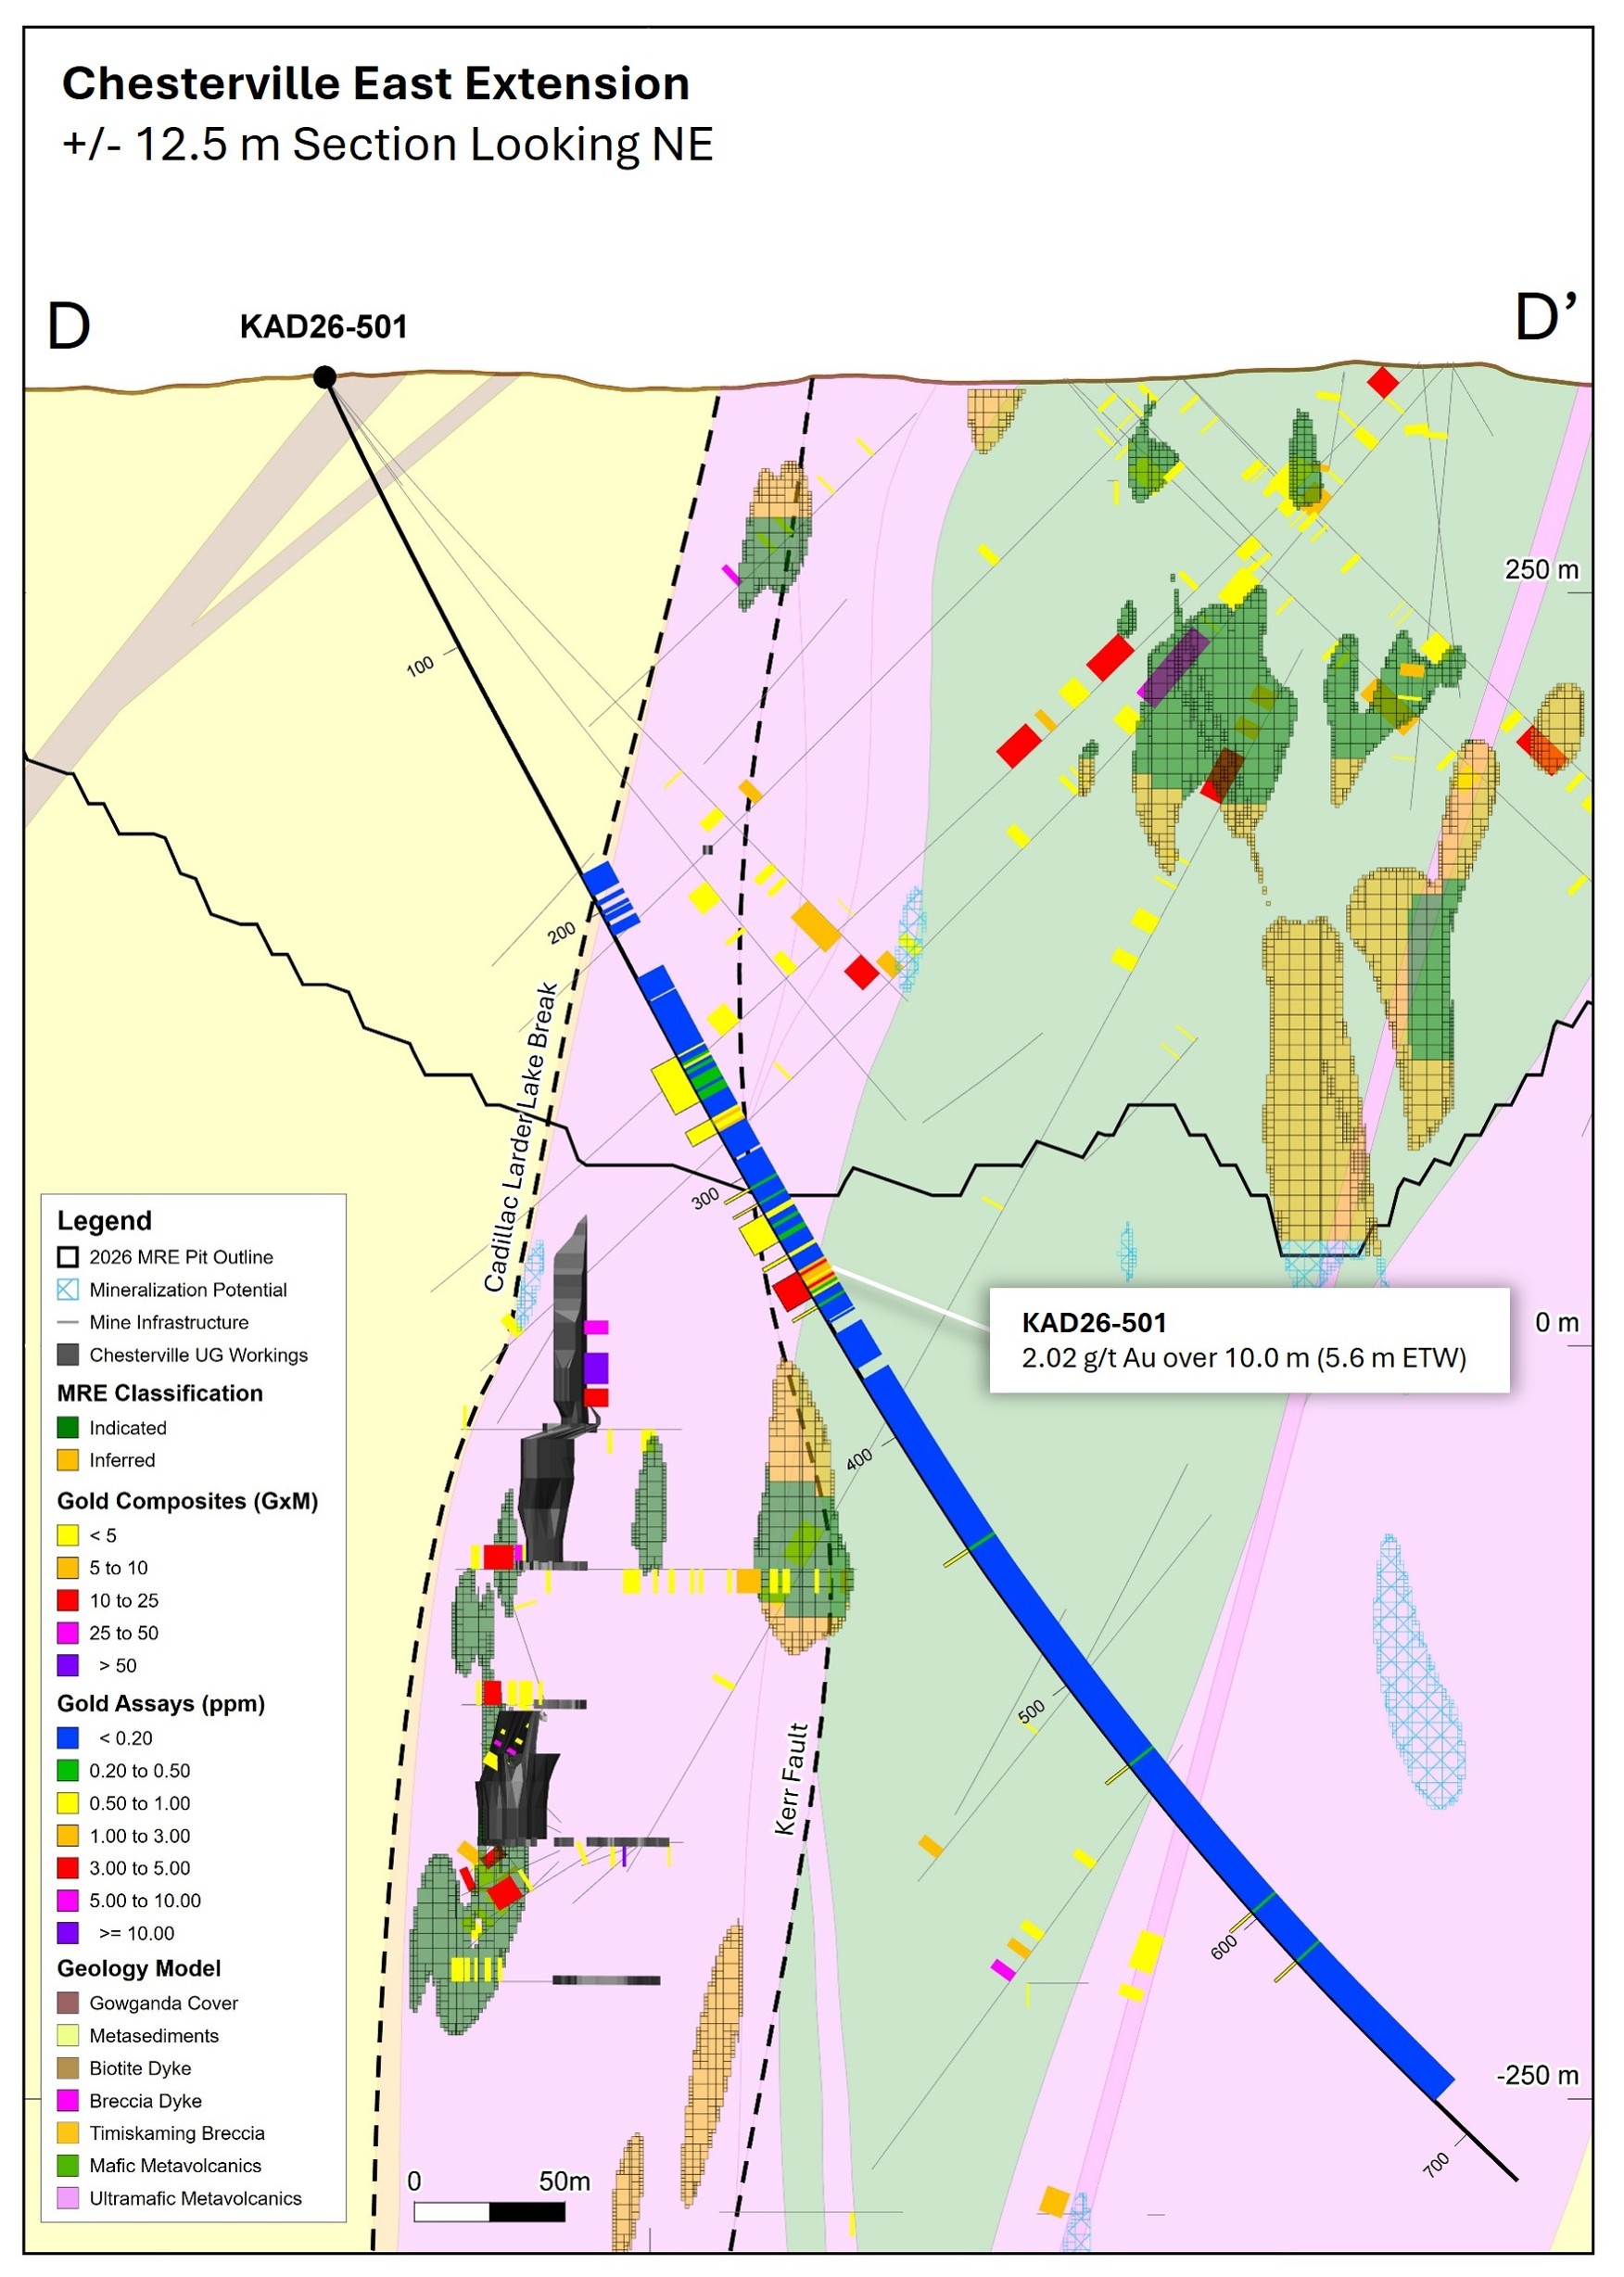
Cross Section D-D' looking northeast, showing drill hole KAD26-501 with 2026 MRE Block Model, Mineralization Potential and 2026 MRE Resource Pit Shell. Previously released and historical drill holes as well as intersections from this release that did not meet the highlight section criteria are shown in grey. Reported intervals are estimated true width.

Cross Section D-D’ looking northeast, showing drill hole KAD26-501 with 2026 MRE Block Model, Mineralization Potential and 2026 MRE Resource Pit Shell. Previously released and historical drill holes as well as intersections from this release that did not meet the highlight section criteria are shown in grey. Reported intervals are estimated true width.

Table 1. Selected Significant Results

Hole ID From (m) To (m) Downhole Interval (m) ETW (m) Au (g/t) Horizon
KAD26-400   362.3 369.5 7.2 4.8 1.72 Footwall
KAD26-404   294.1 299.3 5.2 3.2 2.29 Hangingwall
KAD26-407   350.0 361.0 11.0 4.8 1.36 Footwall
KAD26-411   95.0 100.0 5.0 3.6 1.23 Footwall
KAD26-415   275.0 287.6 12.6 5.2 1.35 Footwall
KAD26-416   436.3 443.6 7.3 4.5 1.25 Hangingwall
KAD26-421


323.0 332.8 9.8 4.3 1.24 Footwall
495.0 500.8 5.8 3.1 1.45 Hangingwall
KAD26-426   288.0 292.2 4.2 3.4 1.22 Hangingwall
KAD26-429   119.7 125.0 5.3 3.0 1.32 Footwall
KAD26-431   392.0 403.7 11.7 8.2 1.57 Hangingwall
KAD26-433


231.3 244.2 12.9 4.6 1.33 Footwall
333.1 355.9 22.9 8.8 1.33 Footwall
Incl. 341.0 349.6 8.6 3.3 2.85 Footwall
KAD26-436


265.0 274.0 9.0 4.5 1.54 Footwall
339.0 352.2 13.2 5.2 1.53 Footwall
KAD26-442

  311.8 340.5 28.8 14.4 1.50 Footwall
Incl. 317.0 327.8 10.8 5.4 3.10 Footwall
KAD26-473


192.0 201.0 9.0 7.5 2.44 Footwall
240.0 244.0 4.0 3.4 3.21 Footwall
KAD26-475


152.2 155.9 3.7 3.2 2.59 Hangingwall
287.0 295.9 8.9 7.5 1.32 Footwall
KAD26-480   21.0 36.0 15.0 9.7 1.42 Footwall
KAD26-484A   149.6 154.0 4.4 3.7 1.53 Hangingwall
KAD26-501   336.0 346.0 10.0 5.6 2.02 Hangingwall
KAD26-507


249.9 267.0 17.1 10.1 1.28 Footwall
511.0 515.0 4.0 3.0 1.48 Footwall
KAD26-527   31.0 37.0 6.0 4.0 1.22 Footwall

Notes on Table 1:

  1. Estimated True Widths (ETW) are estimated based on drill hole Geology or comparison with other on-section drill holes.
  2. The composite assay grades presented in the summary tables are calculated using a minimum average of 0.20 g/t for Au, with a maximum of 3.0 m internal waste and no grade capping.
  3. Selected results presented in this table are those with a composite grade of at minimum 1.20 g/t Au over a minimum interval of 3.0 m.
  4. Full results can be found here.

Table 2. Drill hole locations

Drill Hole Easting Northing Elevation
(masl)
Azimuth Dip Total Length
(m)
Zone
KAD26-400 606355 5332902 316.4 356 -49 495 CVE Extension
KAD26-404 606424 5333012 315.6 343 -47 375 CVE Extension
KAD26-407 606424 5333012 315.6 342 -62 525 CVE Extension
KAD26-411 606465 5333072 302.0 328 -45 273 CVE Extension
KAD26-415 606465 5333072 302.0 330 -60 435 CVE Extension
KAD26-416 606355 5332902 316.4 341 -51 533 CVE Extension
KAD26-421 606424 5333012 315.6 330 -65 555 CVE Extension
KAD26-426 606574 5333474 321.5 195 -51 465 CVE Extension
KAD26-429 606424 5333012 315.6 303 -51 402 CVE Extension
KAD26-431 606559 5333540 319.0 175 -63 645 CVE Extension
KAD26-433 606424 5333012 315.6 314 -65 570 CVE Extension
KAD26-436 606424 5333012 315.6 314 -61 570 CVE Extension
KAD26-442 606424 5333012 316.4 328 -62 483 CVE Extension
KAD26-473 606318 5333260 334.7 170 -45 459 CVE Extension
KAD26-475 606216 5333212 329.9 133 -45 423 CVE Extension
KAD26-480 606278 5332945 332.6 339 -52 342 CVE Extension
KAD26-484A 606216 5333212 329.9 162 -52 549 CVE Extension
KAD26-501 606023 5333138 321.6 149 -63 723 CVE Extension
KAD26-507 606318 5333260 334.7 118 -73 600 CVE Extension
KAD26-527 606368 5333093 317.9 330 -47 165 CVE Extension

Notes on Table 2:

  1. Table contains information for 2026 diamond drill holes of the CVE program with selected results presented in Table 1.
  2. Coordinate system NAD83 UTM Zone 17N.
  3. Full drill collar table can be found here.

2026 Exploration Summary and Outlook

Kerr-Addison is the flagship property of Cadillac Mines and is located along the historic Cadillac Larder Lake Break. In 2026, Cadillac is executing its largest ever annual drill campaign, targeting the completion of 145,000 meters of diamond drilling across its entire property portfolio, including Larder and Galloway, at a budgeted cost of approximately $65 million. Through the end of August 2026, Cadillac completed 89,373 metres of drilling, representing 61% of the full-year target. Currently Cadillac is operating 11 diamond drill rigs, with five focused on expanding mineralization at its newly acquired Galloway Property, one currently testing below the known mineralization at the Geminid Nickel target, and the remainder targeting infill and expansionary drilling at Kerr-Addison. It is expected that as the infill program winds down, existing rigs will be re-deployed to the Larder Project early in the fourth quarter.

During the fourth quarter, Cadillac Mines will also be planning and implementing a property wide airborne geophysical survey covering the Larder, Galloway and Kerr properties along with a ground based deep penetrating MT geophysical survey. In addition, Cadillac has contracted Geologic AI to scan over 40,000 m of historic Galloway core from the 400-hole historical diamond drill database, collecting continuous XRF chemistry plus hyperspectral mineralogy to aid in the geologic interpretation and re-assaying of select intervals of core for Copper and Molybdenum.

Mineral Resource Estimate

The third MRE for the Kerr-Addison Deposit was prepared in accordance with the CIM Definition Standards (2014) and CIM Best Practice Guidelines (2019), as incorporated by reference in NI 43-101. The effective date of the latest MRE is February 27, 2026, and the estimate was completed under the supervision of Maxime Ménard, P.Geo., the Qualified Person responsible for the estimate.

Table 3. 2026 Mineral Resource Estimate

Resource Category Tonnage
(Mt)
Gold Grade
(g/t)
Metal Content
(Moz Au)
Open Pit      
Indicated 74.3 1.3 3.0
Inferred 13.6 0.6 0.3
Underground      
Indicated 4.1 2.6 0.4
Inferred 12.3 4.9 1.9
Total      
Indicated 78.5 1.3 3.4
Inferred 25.9 2.7 2.2

Notes on Table 3:

  1. The Mineral Resource Estimate has been prepared in accordance with the CIM Definition Standards (2014) and CIM Best Practice Guidelines.
  2. Numbers may not sum due to rounding.
  3. Contained metal values are calculated using unrounded tonnage and grade values.
  4. Mineral Resources are reported within constraining shapes that demonstrate reasonable prospects for eventual economic extraction.
  5. Open pit Mineral Resources are reported within a conceptual pit shell using a cut-off grade of 0.20 g/t Au, based on the following parameters: gold price of USD 2,300/oz, exchange rate of 0.73 USD/CAD (1.37 CAD/USD), gold recovery of 91%, payable factor of 99%, royalty of 3%, selling cost of USD 5/oz, processing and G&A cost of CAD 16.50/t, mining cost of CAD 3.50/t mined, and an overall slope angle of 50°.
  6. Underground Mineral Resources are reported within optimized stope shapes generated using the Deswik Stope Optimizer (DSO), based on a longhole open stoping mining method. These shapes were generated using a cut-off grade of 1.2 g/t Au, based on the following parameters: gold price of USD 2,300/oz, exchange rate of 0.73 USD/CAD (1.37 CAD/USD), gold recovery of 91%, payable factor of 99%, royalty of 3%, selling cost of USD 5/oz, processing and transport cost of CAD 13.60/t, mining cost of CAD 90.13/t mined, and G&A cost of CAD 6.72/t, for a total operating cost of CAD 110.45/t. Reported grades are undiluted and reflect in-situ estimates constrained by these shapes.
  7. Bulk density values range from approximately 2.7 t/m³ to 2.94 t/m³, depending on lithology.
  8. Mineral Resources have been classified in accordance with CIM guidelines; no Measured Mineral Resources have been defined.
  9. Blocks located within historical mined voids and within the overburden had their gold value set to zero and are excluded from the Mineral Resource Estimate.
  10. Underground Mineral Resources located within 12 m of historical stopes are reported as remnant material due to increased mining complexity and operational risks associated with extracting material adjacent to historical workings.
  11. The Qualified Person responsible for the Mineral Resource Estimate is Maxime Ménard, P.Geo.
  12. The Mineral Resource Estimate is based on an octree block model with a parent block size of 5 m × 5 m × 5 m, constructed in Leapfrog Edge and constrained by geological domains, topography and historical void models.

Quality Assurance and Quality Control Procedures

Cadillac Mines maintains an internal quality assurance and quality control (QA/QC) program at the Kerr-Addison Project to ensure sampling and analysis of all exploration work is conducted in accordance with industry-standard best practices.

Drill core is logged and sampled at core logging facilities in Virginiatown and Rouyn-Noranda under the supervision of a Qualified Geologist. Sample intervals are selected by a geologist based on geological observations, with sample numbers, certified reference materials (CRMs), and blanks inserted into the sample sequence and recorded in the database. Drill core is cut in half using an automated core saw equipped with a diamond-tipped blade. One half of the core is placed in labelled plastic sample bags and then packaged in rice bags for shipment, while the remaining half is returned to the core box and retained for future reference. Saws and surrounding areas are thoroughly cleaned at the end of every shift and between each hole.

Core samples are transported by Manitoulin Transport to ALS Geochemistry in Thunder Bay for sample preparation and gold analysis and then shipped to ALS Geochemistry in North Vancouver for multi-element analysis. Sample preparation includes crushing the sample to at least 70% passing 2 mm. A 500 g sub-sample is collected using a riffle splitter, transferred into a sealed and uniquely coded jar, and analyzed for gold by Photon Assay. A second sub-sample of up to 250 g is collected using a riffle splitter, pulverized to at least 85% passing 75 microns, and analyzed for multi-element chemistry using four-acid digestion of a 0.25 g analytical split with an ICP-AES finish.

Cadillac Mines inserts CRMs (5%), blanks (5%), and duplicate (5%) samples into the sample stream to monitor analytical accuracy, contamination, and sampling precision. ALS Laboratories are an ISO/IEC accredited laboratory and maintain internal quality control procedures, including the insertion of laboratory blanks, reference materials, and pulp duplicates.

Qualified Person

Mr. Kerry Sparkes, M.Sc. P.Geo is Cadillac’s SVP Exploration and the Qualified Person who has approved the technical information disclosed in this release.

Messrs. Maxime Menard, P.Geo and Sunil Koppalkar, P.Eng., from G Mining Services Inc. are the Qualified Persons (QPs) responsible for the preparation of the Kerr Addison Mineral Resource Estimate.

About Cadillac Mines

Cadillac Mines Corporation is a Canadian mineral exploration company advancing a growing portfolio of gold and critical mineral projects along the prolific Cadillac-Larder Lake Break in Ontario and Québec. Anchored by the historic Kerr-Addison Mine, the Company is focused on expanding its gold resource base, advancing the Geminid nickel deposit and unlocking the broader potential of its district-scale Abitibi land position. Through disciplined exploration, technical excellence and responsible development, Cadillac Mines is working to create lasting value for shareholders, communities and other stakeholders. For more information about the Company, please visit www.cadillacmines.com.

For further information, please contact:

Hannes Portmann, Chief Financial Officer
hportmann@cadillacmines.com 

Forward-Looking Information

This news release includes certain “forward-looking statements” under applicable Canadian securities legislation. Forward-looking statements include, but are not limited to, statements with respect to future development plans and the business and operations of the Company. Forward-looking statements are necessarily based upon estimates and assumptions that, while considered reasonable, are subject to known and unknown risks, uncertainties and other factors which may cause the actual results and future events to differ materially from those expressed or implied by such forward-looking statements. Such factors include, but are not limited to business integration risks; fluctuations in general macroeconomic conditions; fluctuations in securities markets; fluctuations in spot and forward prices of gold, silver, base metals or certain other commodities; fluctuations in currency markets; results of exploration; the economics of processing methods; change in national and local government, legislation, taxation, controls, regulations and political or economic developments; risks and hazards associated with the business of mineral exploration, development and mining (including environmental hazards, industrial accidents, unusual or unexpected formations pressures, cave-ins and flooding); inability to obtain adequate insurance to cover risks and hazards; the presence of laws and regulations that may impose restrictions on mining; employee relations; relationships with and claims by local communities and indigenous populations; availability of and increasing costs associated with mining inputs and labour; the speculative nature of mineral exploration and development (including the risks of obtaining necessary licenses, permits and approvals from government authorities); and title to properties.

There can be no assurance that such statements will prove to be accurate, as actual results and future events could differ materially from those anticipated in such statements. Accordingly, readers should not place undue reliance on forward-looking statements. The Company disclaims any intention or obligation to update or revise any forward-looking statements, whether as a result of new information, future events or otherwise, except as required by law.

Photos accompanying this announcement are available at:
https://www.globenewswire.com/NewsRoom/AttachmentNg/abf25d8b-020b-47d4-a29c-2ad92d26acb9
https://www.globenewswire.com/NewsRoom/AttachmentNg/aee073fe-93ea-458c-98ad-a138b380bd56
https://www.globenewswire.com/NewsRoom/AttachmentNg/f6fff920-f4bd-4d80-85e0-889c07beacf1
https://www.globenewswire.com/NewsRoom/AttachmentNg/606fcf06-4659-465a-8731-aa2bf370ae7b
https://www.globenewswire.com/NewsRoom/AttachmentNg/0712fac9-064c-41d0-b396-73857b405af9
https://www.globenewswire.com/NewsRoom/AttachmentNg/67ec115d-21c4-45cb-9027-9ff183fa81b5

FREMONT, Calif., Sept. 21, 2026 (GLOBE NEWSWIRE) — Enphase Energy, Inc. (NASDAQ: ENPH), a global energy technology company, today announced that the Enphase® IQ® Meter Collar is now approved for behind-the-meter installation by 80 utilities that collectively serve more than 38 million customers across the United States and Canada.

The IQ Meter Collar is now approved by all three major investor-owned electric utilities in California and the Sacramento Municipal Utility District (SMUD), expanding access to whole-home backup across the state. Hawaiian Electric has also approved initial pilot installations, with full approval expected in the coming months. Additional utility approvals are expected soon. See the full list on the Enphase website.

The IQ Meter Collar is a compact microgrid interconnection device that mounts behind the utility meter or on a standalone meter socket. It enables whole-home backup without moving circuits to a dedicated backup sub-panel or installing additional consumption current transformers, while providing safe grid isolation. As a key component of the 4th-generation Enphase Energy System, alongside the IQ® Battery 10C and the IQ® Combiner 6C, it helps reduce equipment, wiring complexity, and installation time. With integrated metering and streamlined commissioning, the system helps installers complete more installations in a single day and is backed by a 15-year limited warranty.

“Utility approval of the Enphase meter collar opens the door for us to deploy whole-home backup at much greater scale,” said Dan Moncayo, owner of HPM Solar, an installer of Enphase products based in Southern California. “The IQ Meter Collar significantly simplifies installation, reduces equipment on the wall, and helps us deliver a cleaner, faster experience for homeowners while meeting utility requirements.”

“With SMUD approving the IQ Meter Collar, we now have a streamlined way to offer whole-home backup that aligns with local utility standards,” said Ed Murray, president of Aztec Solar, an installer of Enphase products based in Northern California. “It allows us to complete installations more efficiently and expand access to reliable home energy systems for more customers.”

“Hawaii has one of the highest electricity rates in the country and a real need for resilient, whole-home backup,” said Cruz Romero, owner of Hi Power Solar, an installer of Enphase products based in Hawaii. “The IQ Meter Collar gives us a faster, cleaner way to deliver that to homeowners across the islands, with less equipment on the wall and fewer steps in the install.”

“With utility approval of the IQ Meter Collar now in place, we’re able to accelerate battery deployments across our service territory in ways we couldn’t before,” said Kent Harle, CEO of Stellar Solar, an installer of Enphase products based in San Diego. “In markets like San Diego, where programs like the San Diego Community Power Solar Battery Savings program are creating real financial incentives for homeowners, having a faster, simpler installation solution means we can help more customers take advantage of those opportunities before they’re gone.”

“Getting utility approval for the IQ Meter Collar has opened up a whole new level of service for our customers,” said Jeff Long, president and CEO of Infinium Solar, an installer of Enphase products based in the PG&E service territory. “We can now offer whole-home backup with a simpler installation process, which means faster deployments and a better experience for homeowners.”

“Utility approvals are critical to scaling whole-home backup,” said Ken Fong, senior vice president of sales at Enphase Energy. “With the IQ Meter Collar now approved by 80 utilities, we are removing a key barrier to battery adoption, enabling installers to bring our 4th-generation Enphase Energy System to more homeowners, faster and more efficiently.”

For more information about the IQ Meter Collar and the 4th-generation Enphase Energy System, please visit the Enphase website.

About Enphase Energy, Inc.

Enphase Energy, a global energy technology company based in Fremont, CA, is the world’s leading supplier of microinverter-based solar and battery systems, EV chargers, home energy management systems, and virtual power plant (VPP) solutions. Enphase products enable people to harness the sun to make, use, save, and sell their own power, all controlled through the Enphase App. The company revolutionized the solar industry with its microinverter-based technology and has shipped approximately 89.4 million microinverters, with approximately 5.3 million Enphase-based systems deployed in over 165 countries. For more information, visit https://enphase.com/.

©2026 Enphase Energy, Inc. All rights reserved. Enphase Energy, Enphase, the “e” logo, IQ, and certain other marks listed at https://enphase.com/trademark-usage-guidelines are trademarks or service marks of Enphase Energy, Inc. Other names are for informational purposes and may be trademarks of their respective owners.

Forward-Looking Statements

This press release may contain forward-looking statements, including statements related to the expected capabilities and performance of Enphase Energy’s technology and products, including safety, quality, functionality, and reliability; the expected benefits of the IQ Meter Collar; the timing of utility approvals; the timing and availability of Enphase Energy products; the expected approval of the IQ Meter Collar by additional utilities; and anticipated installer and homeowner benefits. These forward-looking statements are based on Enphase Energy’s current expectations and assumptions and inherently involve significant risks and uncertainties. Actual results and the timing of events could differ materially from those contemplated by these forward-looking statements as a result of such risks and uncertainties. Such risks include, but are not limited to, market demand for home energy systems, battery storage systems, and related products; competitive developments; utility approval processes and requirements; changes in utility programs, incentive programs, regulatory requirements, or compliance standards; product performance and reliability under actual operating conditions; supply chain availability and costs; and other factors discussed in Enphase Energy’s filings with the Securities and Exchange Commission, including those risks described in more detail in Enphase Energy’s most recently filed Annual Report on Form 10-K, Quarterly Report on Form 10-Q, and other filings made from time to time with the Securities and Exchange Commission. Enphase Energy undertakes no duty or obligation to update any forward-looking statements contained in this release as a result of new information, future events, or changes in its expectations, except as required by law.

Contact:

Enphase Energy
press@enphaseenergy.com

SYDNEY, AUSTRALIA, Sept. 21, 2026 (GLOBE NEWSWIRE) — Immutep Limited (ASX: IMM; NASDAQ: IMMP) (“Immutep” or “the Company”), a late-stage immunotherapy company targeting cancer and autoimmune diseases, today announces a change to the ratio of its American Depositary Shares (“ADSs”), which are quoted on the Nasdaq Global Market under the symbol IMMP.

With effect from the commencement of trading on the Nasdaq Global Market on 28 September 2026 (US Eastern time), the ADS ratio will change from one (1) ADS representing ten (10) ordinary shares to one (1) ADS representing two hundred (200) ordinary shares. For holders of ADSs, the change has the same practical effect as a reverse split of the ADSs on the basis of one (1) new ADS for every twenty (20) ADSs held.

The Company’s ordinary shares quoted on the ASX are not affected by the change. The number of ordinary shares on issue does not change, no ordinary shares are being issued or cancelled, and the change does not alter the proportionate economic interest of any shareholder or ADS holder in the Company, other than in respect of fractional entitlements as described below. The change does not require shareholder approval.

Item Detail
Current ratio 1 ADS = 10 ordinary shares
New ratio 1 ADS = 200 ordinary shares
Exchange ratio 1 “new” ADS for every 20 “old” ADSs held
Effective date 28 September 2026 (US Eastern time)
Nasdaq ticker IMMP (unchanged)
Old ADS CUSIP 45257L108
New ADS CUSIP 45257L207
Ordinary share ISIN AU000000IMM6 (unchanged)
ADSs on issue Approximately 32.8 million before the change; approximately 1.64 million after the change.
Ordinary shares on issue 1,473,721,306 (unchanged)
Fractional entitlements Cash in lieu, no fee deducted, expected to be paid one to two days after the effective date
ADS cancellation fee Nil for this event
Depositary The Bank of New York Mellon (“BNY”), under the deposit agreement dated 16 April 2012

Reason for the change

As announced on 30 April 2026, Immutep received notification from The Nasdaq Stock Market LLC (“Nasdaq”) that the closing bid price of its ADSs had been below US$1.00 for 30 consecutive business days and that the Company was therefore not in compliance with the minimum bid price requirement for continued listing on the Nasdaq Global Market under Nasdaq Listing Rule 5450(a)(1). To regain compliance, the closing bid price of the ADSs must be at or above US$1.00 for a minimum of 10 consecutive business days, which Nasdaq may in its discretion extend to up to 20 consecutive business days, before the end of the compliance period on 26 October 2026.

The change in ADS ratio is a technical step directed at that requirement. In setting the new ratio, the Board took into account that a further minimum bid price deficiency arising within 12 months of a ratio change does not attract an additional compliance period. The ratio has accordingly been set to provide a generous margin above the US$1.00 requirement rather than to reflect the current trading price of the ADSs.

The Company remains listed on the Nasdaq Global Market and its ordinary shares remain quoted on the ASX. The change in ratio does not affect the number of ordinary shares on issue, the Company’s capital structure, its cash position or its clinical development programmes.

Effect on ADS holders

• On the effective date, every twenty (20) existing ADSs will be exchanged for one (1) new ADS. The exchange is mandatory, and it occurs automatically for ADSs held in the Direct Registration System or through the Depository Trust Company, so no action is required by those holders. Any holder who still holds a physical ADR certificate should contact BNY or their broker.

• Only whole ADSs will be issued. BNY will aggregate and sell the ADSs representing fractional entitlements and distribute the cash proceeds to the holders entitled to them. No fee will be deducted from that payment, which BNY expects to make one to two days after the effective date.

• The Nasdaq ticker IMMP is unchanged and the ISIN of the Company’s ordinary shares is unchanged. A new CUSIP and a new ISIN will apply to the ADSs.

• BNY’s books will be closed for all issuance and cancellation transactions on CUSIP 45257L108 from the close of business September 25, 2026. BNY anticipates that on September 28, 2026, the books will be opened for all issuance and cancellation transactions on CUSIP 45257L207. Holders with a conversion between ordinary shares and ADSs in progress over that period should contact their broker.

• A change in the ADS ratio may affect the fees payable by ADS holders under the deposit agreement, as those fees are charged by the depositary on a per-ADS basis.

• BNY will issue a notice of the change to the Depository Trust Company and to Nasdaq, and will post that notice on its depositary receipts website, adrbny.com. Holders who hold through a broker, bank or nominee should direct questions about their own holding to that intermediary.

• Holders of ordinary shares on the ASX need take no action; their holdings are unchanged.

Regulatory process and indicative timetable

The Company has lodged the Nasdaq Company Event Notification Form in respect of the change. A Form 6-K will be furnished to the U.S. Securities and Exchange Commission, and the revised form of American Depositary Receipt will be filed with the U.S. Securities and Exchange Commission by the depositary pursuant to Rule 424(b)(3). The change does not require any corporate action in respect of the Company’s ASX-quoted ordinary shares.

Date Step
28 September 2026 Ratio change effective; ADSs begin trading on the new basis under the new CUSIP
29 September 2026 First trading day counted towards the minimum bid price requirement
On or about 30 September 2026 Cash in lieu of fractional entitlements paid
26 October 2026 End of the Nasdaq compliance period


Dates after the effective date are indicative and depend on the depositary’s and Nasdaq’s processing.

About Immutep

Immutep is a late-stage biotechnology company developing novel immunotherapies for cancer and autoimmune disease. The Company is a pioneer in the understanding and advancement of therapeutics related to Lymphocyte Activation Gene-3 (LAG-3), and its diversified product portfolio harnesses LAG-3’s ability to stimulate or suppress the immune response. Immutep is dedicated to leveraging its expertise to bring innovative treatment options to patients in need and to maximise value for shareholders. For more information, please visit www.immutep.com.

Forward-Looking Statements

This press release contains forward-looking statements, including statements regarding the timing and implementation of the change in ADS ratio and the Company’s expectation of regaining compliance with the Nasdaq minimum bid price requirement. These forward-looking statements are based on current expectations, estimates and projections, and involve known and unknown risks, uncertainties and other important factors that could cause actual results to differ materially from those expressed or implied in such statements.

Factors that could cause actual results to differ materially include risks associated with clinical trial outcomes, regulatory developments, and the Company’s ability to advance its product candidates.

Readers are cautioned not to place undue reliance on forward-looking statements, which speak only as of the date of this release. Immutep undertakes no obligation to update or revise such statements, except as required by applicable law.

Disclaimer

This announcement has been prepared for informational purposes only and does not constitute an offer to sell, or a solicitation of an offer to buy, securities in any jurisdiction.

Australian Investors/Media:
Eleanor Pearson, Sodali & Co.
+61 2 9066 4071; eleanor.pearson@sodali.com

US Investors/Media
Matthew Beck, astr partners
+1 (917) 415-1750; matthew.beck@astrpartners.com

This announcement was authorised for release by the Board of Immutep Limited.

More than 140,000 home batteries dispatched power to California’s statewide energy grid during extreme heat on September 9, 2026, equaling the capacity of a large power plant

SAN FRANCISCO, Sept. 21, 2026 (GLOBE NEWSWIRE) — Sunrun (Nasdaq: RUN) and Tesla (Nasdaq: TSLA) announced today that the companies’ fleets of home batteries dispatched more than 580 megawatts of peak power to California’s grid on the evening of September 9, 2026. The combined output marks the largest distributed power plant dispatch event on record—with enough capacity to power all households in Sacramento County during peak hours.

The dispatch event occurred amid scorching temperatures, elevated demand for electricity, and the resulting increase in wholesale energy rates. At the request of the California Energy Commission and utilities, Sunrun and Tesla discharged their customers’ home batteries to the grid for a three-hour evening period to increase the grid’s operating margin and put downward pressure on real-time energy prices.

Sunrun and Tesla coordinated 580 megawatts of residential battery capacity during the event—combining 517 megawatts from Tesla Powerwalls with 63 megawatts from additional batteries. 110,000 Powerwalls participated in the event; more than half of those (55%) are owned and operated by Sunrun. In addition, Sunrun dispatched more than 30,000 of its customers’ batteries from other manufacturers.

“Sunrun’s distributed home batteries are operating at a scale larger than many peaker power plants combined,” said Sunrun CEO Mary Powell. “Families depend on their Sunrun energy systems for outage protection and energy independence. This historic dispatch shows that the benefits of distributed energy go well beyond individual households as we help control the cost of electricity for all Californians and reduce the need for new costly poles and wires.”

The dispatch event was coordinated through two statewide grid service programs: the California Energy Commission’s Demand Side Grid Support (DSGS) program and the California Public Utilities Commission’s Emergency Load Reduction Program (ELRP). The participating batteries were located statewide, with customers participating in all three investor-owned utilities’ service territories.

The DSGS dispatch event was triggered by the California Independent System Operator’s day-ahead locational marginal price exceeding $200 per megawatt-hour. The ELRP dispatch was an event called to coincide with the heat wave by Pacific Gas and Electric Company for batteries located within its territory.

An even larger distributed power plant event in California is possible from Sunrun’s and Tesla’s battery fleets. The Sept. 9 event did not dispatch the companies’ additional batteries participating in the ELRP program in Southern California Edison’s territory.

However, the following evening, Sept. 10, Southern California Edison requested a three-hour dispatch during peak hours. Together, Sunrun and Tesla delivered more than 140 megawatts of battery capacity to the grid. Had the dispatch events from Sept. 9 and 10 occurred on the same night, Sunrun and Tesla would have had the ability to deliver over 720 megawatts in a single dispatch.

A report by The Brattle Group, commissioned by Sunrun and Tesla, found that these kinds of programs could provide up to $206 million in net cost savings to Californians by 2028. These savings would benefit all grid-connected customers, the report said. Additionally, participants benefit from direct compensation for the power they share with the grid.

The historic dispatch event provides a strong proof point for Sunrun, Tesla, and Renew Home’s existing initiative to unlock more than 16.8 gigawatts of flexible capacity for hyperscalers and utilities from home batteries, solar, smart thermostats, and EVs. The three companies announced earlier this month that they will enroll nearly 21,000 existing flexible energy devices into a new, Google-funded distributed power plant with PG&E. The resource is expected to begin supporting the grid as early as this fall.

About Sunrun
Sunrun Inc. (Nasdaq: RUN) is America’s largest provider of home battery storage, solar, and home-to-grid power plants. As the pioneer of home energy systems offered through a no-upfront-cost subscription model, Sunrun empowers customers nationwide with greater energy control, security, and independence. Sunrun supports the grid by providing on-demand dispatchable power that helps prevent blackouts and lowers energy costs. Learn more at www.sunrun.com.

Media Contact
Wyatt Semanek
Sr. Director, Corporate Communications
press@sunrun.com

Investor & Analyst Contact
Patrick Jobin
SVP, Deputy CFO & Investor Relations Officer
investors@sunrun.com

Ahead of an extensive completions program at the Lawson Complex, aimed at confirming the world’s first large-scale commercial discovery of an emerging new primary energy source, the 30-km step-out at Lawson 5 sets the stage for a robust new phase of exploration targeting the basin-scale potential of Natural Hydrogen in Saskatchewan.

New Video: The Next Chapter
https://youtu.be/LUIHqS35rMg

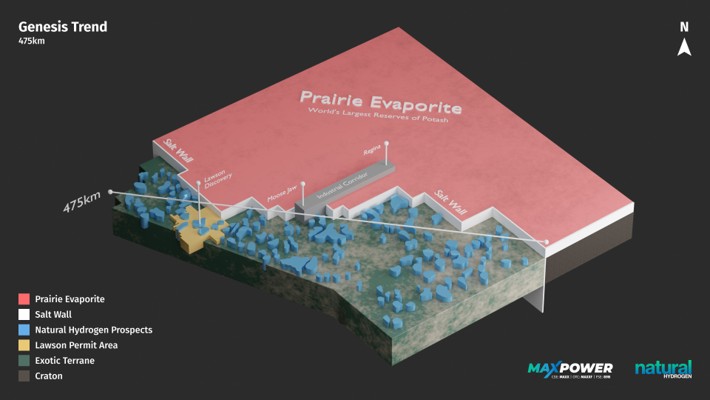
REGINA, Saskatchewan, Sept. 21, 2026 (GLOBE NEWSWIRE) — MAX Power Mining Corp. (CSE: MAXX; OTC: MAXXF; FSE: 89N) (“MAX Power” or the “Company”) is pleased to provide the following exploration and operations update as crews prepare to mobilize for ramped-up drilling aimed at adding even greater scale to both the Lawson Complex Natural Hydrogen Discovery and the geological potential of the entire 475-km-long (~300-mile) Genesis Trend that stretches from south-central Saskatchewan to the North Dakota border.

Highlights

  • Savanna Drill Rig #629 and crew are preparing to mobilize for the largest step-out yet (Lawson 5) as part of the Lawson Discovery, targeting an area approximately 27 to 31 km northeast of the current discovery represented by the first four wells – Lawson 1 to Lawson 4. Savanna Rig #629 is a top drive tele-scopic double;
  • Lawson 5 has two key objectives, each testing the scale potential of the broader Genesis Trend – west to east across a 30-km mobile belt, and north-to-south along the “Salt Wall” flanking the Prairie Evaporite that extends 475 km (~300 miles) down the Genesis Trend to the North Dakota border;
  • Lawson 4 has been successfully cased and cemented after drilling encountered the highest Natural Hydrogen readings to date at Lawson, a thick basal Cambrian reservoir with high permeability and porosity, exotic terrane source rocks, and a sub-vertical crustal fault (conduit) with an unknown depth extent in the Precambrian basement complex.

Mr. Steve Halabura, MAX Power Chief Geoscientist, commented: “Lawson 5 will give us the information we need with respect to an additional important trap and seal mechanism on the Genesis Trend, beyond the ones we have already identified, and other data, to launch an aggressive exploration program along the broader Salt Wall Corridor continuing north-south for at least 475 km. In addition, Lawson 5 will test the west-to-east up-dip potential, across a mobile belt, of the current discovery. What this is quickly building up to, given our confidence in the science, is an even more robust program of exploratory drilling at Genesis and elsewhere, concurrent with an extensive completions program covering the Lawson discovery wells slated to begin soon. All of this will provide a massive input of new data into MAXX LEMI, our AI-assisted proprietary platform that Kyndryl is developing a commercialization strategy for (refer to Sept. 18, 2026 news release).”

Bracken Well Update

While Lawson 5 represents the biggest step-out to date associated with the current discovery area, the Bracken well along the Saskatchewan-Montana border completed earlier this year stepped out 325 km from the Lawson Complex to the Grasslands Projects in the southwest and underscored the basin-scale potential of Natural Hydrogen deposits in Saskatchewan (refer to June 30, 2026 news release).

Independent petrophysical evaluation by GLJ Ltd. (“GLJ”), one of the world’s leading energy consultants, identified multiple prospective Natural Hydrogen and helium zones at Bracken. The well was successfully cased and cemented, and a near-term completions program is planned at Bracken to coincide with Lawson completions.

Figure 1 – The Genesis Trend

Figure 1

Why This Matters to Investors

Lawson 5 marks a pivotal shift in the MAX Power story. The first four Lawson wells have progressively defined Canada’s first confirmed subsurface Natural Hydrogen system. Now MAX Power is stepping out approximately 30 km northeast to begin testing something potentially much larger, including whether the geological architecture being identified at Lawson extends to the Salt Wall and across the broader 475 km Genesis Trend. With Bracken also showing multiple prospective Natural Hydrogen and helium zones approximately 325 km southwest, on a different trend, the opportunity is increasingly moving beyond the boundaries of a single discovery area. 

The bigger thesis is basin scale. Completions testing at Lawson and Bracken will begin addressing flow, composition and deliverability, while Lawson 5 also takes the first major step toward testing scale across a vastly larger geological corridor potentially extending across the entire Salt Wall flanking the full eastern border of Genesis. Every new well also expands the proprietary geological, geophysical and reservoir dataset feeding MAXX LEMI, creating a growing intelligence layer alongside MAX Power’s exploration assets.

Lawson established the first subsurface discovery of Natural Hydrogen in Canada. The next phase is about proving deliverability and testing just how big this basin scale Natural Hydrogen opportunity could become.

Figure 2: Drilling at Lawson 3 Well, Genesis Trend (Aug. 2026)

Figure 2

Stay Connected by Following Us On

X (formerly Twitter): x.com/MaxPowerMining
LinkedIn: linkedin.com/company/max-power-mining-corp
Instagram: instagram.com/maxpowerminingcorp
YouTube: youtube.com/@maxpowerminingcorp
and by joining our Telegram channel: t.me/MaxpowerMining

Recent Videos

Video: The Time is Now
https://youtu.be/TKnEnBEQ0TM

What if the Answer to Natural Hydrogen Was Beneath Our Feet All Along?
https://youtu.be/srV-RCmzzPk

President Chad Levesque On Significance of Lawson
https://youtu.be/wCeFQTKtOuI

What is Natural Hydrogen?
https://www.youtube.com/watch?v=S0bqqZeIpxc

Genesis Explained: Its “Salt Barrier” Advantage and Proximity to Demand
https://www.youtube.com/watch?v=3ytpHdve6S8

The Genesis Trend’s Industrial Corridor
https://youtube.com/shorts/IAgALH_s3mI

Lawson – Canada’s First Big Step into Natural Hydrogen
https://www.youtube.com/watch?v=lTTOwMxz_zo

MAX Power Leaps at Lawson
https://www.youtube.com/watch?v=Yr4Ha06__Eg

Watch the Drill in Action
https://www.youtube.com/watch?v=eguNGAfdIek

MAX Power Saskatchewan Natural Hydrogen Documentary Video
https://www.youtube.com/watch?v=TXGDtTUbJ2c

History in The Making at Lawson – Video Immediately Ahead of Drill Rig Setup
https://www.youtube.com/watch?v=BNHazk9Sy4E

About MAX Power

MAX Power is an innovative mineral and energy exploration company focused on the shift to decarbonization. The Company’s Lawson Discovery near Central Butte, Saskatchewan, represents Canada’s first-ever subsurface Natural Hydrogen system confirmed through deep drilling with data validated by three independent labs. MAX Power has built dominant district-scale land positions across Saskatchewan with approximately 2.5 million acres (~1 million hectares) of permits covering prime exploration ground prospective for large-volume accumulations of Natural Hydrogen, and has commenced a multi-well follow-up drill program to validate the commerciality of the broader Lawson Complex interpreted to cover a 28 sq. km area along the 475-km Genesis Trend. MAX Power also holds a significant equity position in Homeland Critical Minerals, which now owns the Willcox Project in Arizona, a lithium discovery confirmed in early 2024 by MAX Power. MAX Power is committed to responsible exploration and development practices that prioritize environmental stewardship, meaningful community engagement, and strong corporate governance.

On behalf of the Board of Directors,

Ran Narayanasamy, CEO
MAX Power Mining Corp.
info@maxpowermining.com

For further information, please contact:

Chad Levesque, President
Ph: 1-306-981-4753
chad@maxpowermining.com

Media Contact:

Sarah Mawji, Venture Strategies
sarah@venturestrategies.com

Cautionary Statement and Forward-Looking Information

This news release contains certain forward-looking statements and forward-looking information (collectively, “forward-looking information”) within the meaning of applicable securities laws. Forward-looking information is often identified by words such as “anticipate”, “believe”, “continue”, “could”, “estimate”, “expect”, “intend”, “may”, “plan”, “potential”, “predict”, “project”, “should”, “will” and similar expressions.

Forward-looking information is based on management’s current expectations, estimates, projections and assumptions, including, among other things, that required regulatory approvals will be obtained, financing will be available on acceptable terms, planned exploration, appraisal and development activities will proceed as anticipated, equipment and personnel will be available as required, geological interpretations and technical results will support further advancement of the Company’s projects, and market conditions will remain favourable.

Forward-looking information is subject to known and unknown risks, uncertainties and other factors that may cause actual results, performance or achievements to differ materially from those expressed or implied by such forward-looking information. Such risks and uncertainties include, without limitation, risks relating to exploration and development activities, geological and technical uncertainties, commercialization of Natural Hydrogen, reservoir performance, infrastructure availability, strategic partnership opportunities, market acceptance, commodity and energy prices, access to capital, regulatory approvals, environmental and permitting requirements, and general economic, market and business conditions.

There can be no assurance that the Company’s plans, expectations or objectives will be achieved. Readers are cautioned not to place undue reliance on forward-looking information. Forward-looking information contained in this news release is made as of the date hereof and the Company undertakes no obligation to update or revise any forward-looking information, whether due to new information, future events or otherwise, except as required by applicable securities laws.

Additional information regarding the Company and the risks and uncertainties affecting its business and operations is available under the Company’s profile on SEDAR+ at www.sedarplus.ca.

Neither the Canadian Securities Exchange nor its Regulation Services Provider accepts responsibility for the adequacy or accuracy of this release.

Photos accompanying this announcement are available at:
https://www.globenewswire.com/NewsRoom/AttachmentNg/36f8022c-5352-49a2-b079-e272566eb13a
https://www.globenewswire.com/NewsRoom/AttachmentNg/8de2c905-1000-4c1d-a809-d84ef3133793

  • Revenues rose 36.6% year over year, mainly driven by higher average selling prices
  • AI infrastructure and liquid cooling continue to gain strategic importance, with large-volume customer orders secured subsequent to the first half of 2026

SHENZHEN, China, Sept. 21, 2026 (GLOBE NEWSWIRE) — ZJK Industrial Co., Ltd. (NASDAQ: ZJK) (“ZJK” or the “Company”), a high-tech precision parts and hardware manufacturer serving artificial intelligence (AI) infrastructure, consumer electronics, electric vehicles, aerospace, and other smart technologies, today announced its unaudited financial results for the six months ended June 30, 2026.

First Half of Fiscal Year 2026 Financial Highlights

  • Revenues were US$33.74 million for the first half of 2026, an increase of 36.60% from US$24.70 million for the same period of 2025.
  • Gross profit was US$14.29 million for the first half of 2026, an increase of 16.01% from US$12.32 million for the same period of 2025.
  • Net income was US$5.24 million for the first half of 2026, compared with US$5.84 million for the same period of 2025.
  • Basic and diluted earnings per share were US$0.08 for the first half of 2026, compared with US$0.10 for the same period of 2025.
  • Net cash provided by operating activities increased 28.75% year over year to US$3.19 million for the first half of 2026, while net cash provided by investing activities and financing activities increased 254.38% and 78.85%, respectively.
  • Cash and cash equivalents, restricted cash, and short-term investments amounted to US$23.16 million as of June 30, 2026, an increase of 24.37% from US$18.62 million as of December 31, 2025.

Mr. Ning Ding, chairman of the board of directors, chief executive officer and chief financial officer, commented, “We are pleased to report another period of strong revenue growth in the first half of 2026, reflecting our deeper participation in customer programs and the ongoing shift of our product portfolio toward more sophisticated, higher-value products with increased average selling prices. Notably, our revenues grew 36.60% year over year to US$33.74 million.

“As newer and increasingly complex products move into larger-scale production, we have made the necessary investments in materials, labor, manufacturing processes and production capacity to support their ramp-up and meet increasingly stringent customer requirements. We will continue to advance automation and process optimization to enhance manufacturing efficiency, while investing in research and development to strengthen our technical capabilities and support the continued growth of our high-value precision component business.

“On the demand side, AI infrastructure and liquid cooling are becoming increasingly important growth drivers for ZJK, as our strengths in precision manufacturing, product reliability and production consistency enable us to address the increasingly stringent requirements arising from the greater computing density and power consumption of AI systems. Subsequent to the first half of 2026, we secured large-volume purchase orders for AI infrastructure components from several major customers and have commenced deliveries, further demonstrating growing customer recognition of our capabilities across the product development and manufacturing lifecycle, from early-stage design collaboration and validation to engineering, mass production and quality control. Supported by ongoing deliveries under these orders and continued demand from AI and other advanced technology applications, we anticipate that strong growth momentum will continue through the second half of 2026.

“We also continue to execute our global expansion strategy, including the development of our international customer base. We are investing in sales and marketing across North America, Singapore and Taiwan to broaden our market reach beyond mainland China.

“We believe the rapid growth of AI computing infrastructure and adoption of liquid cooling, together with increasing precision requirements across other advanced smart technologies, will create substantial long-term opportunities for ZJK. We will continue to focus on innovation-driven development, operational efficiency, customer diversification and the expansion of our global footprint to enhance our capabilities to capture these opportunities, drive sustainable revenue and profit growth, and deepen ZJK’s strategic role in the global high-precision components supply chain.”

First Half of Fiscal Year 2026 Financial Results

Revenues

Revenues were US$33.74 million for the first half of 2026, an increase of 36.60% from US$24.70 million for the same period of 2025. This increase was mainly due to an increase of 35.29% in the average sales unit price for the six months ended June 30, 2026 compared to the same period of 2025.

Cost of Revenues

Cost of revenues was US$19.45 million for the first half of 2026, an increase of 57.08% from US$12.38 million for the same period of 2025. The increase was driven by higher material procurement prices coupled with increased material consumption from the expanded production scale of new products, and increased labor costs as more personnel were required and more complex manufacturing procedures were involved in the production of new products.

Gross Profit and Gross Profit Margin

Gross profit was US$14.29 million for the first half of 2026, an increase of 16.01% from US$12.32 million for the same period of 2025. This increase was mainly due to the increased average sales unit price of ZJK’s hardware products, partially offset by the decreased sales volume.

The gross profit margin was 42.35% for the first half of 2026, compared with 49.87% for the same period of 2025, mainly attributable to the increase in average unit cost of products. Despite an increase in average sales unit price of products, to remain competitive, such price growth was insufficient to fully offset the incremental manufacturing costs.

Total Operating Expenses

Total operating expenses were US$8.64 million for the first half of 2026, compared with US$6.46 million for the same period of 2025.

  • General and administrative expenses were US$4.11 million for the first half of 2026, an increase of 52.86% from US$2.69 million for the same period of 2025. This increase was primarily attributable to (i) an increase of US$0.63 million in share-based compensation expenses, (ii) an increase of US$0.16 million in salaries and benefits for administrative personnel due to an increase of employee headcounts resulting from ZJK’s business growth, (iii) an increase of US$0.12 million in depreciation and amortization expenses, and (iv) an increase of US$0.40 million in other miscellaneous expenses due to business expansion.
  • Selling and marketing expenses were US$4.24 million for the first half of 2026, an increase of 19.33% from US$3.56 million for the same period of 2025. This increase was primarily due to (i) an increase of US$0.31 million in sales commissions resulting from business expansion into markets such as North America, Singapore, and Taiwan, China, (ii) an increase of US$0.10 million in salaries and benefits for sales and marketing personnel due to higher headcounts to support ZJK’s business expansion, and (iii) an increase of US$0.18 million in freight costs for sale of products, reflecting expanded overseas shipping demands.
  • Research and development expenses were US$0.28 million for the first half of 2026, an increase of 32.28% from US$0.21 million for the same period of 2025. This increase was primarily attributable to salaries and benefits for an increased number of research and development personnel resulting from business growth.

Income from Operations

Income from operations was US$5.66 million for the first half of 2026, compared with US$5.86 million for the same period of 2025.

Other Income, Net

Other income, net was US$1.37 million for the first half of 2026, compared with US$1.91 million for the same period of 2025, primarily due to a decrease in foreign exchange gains.

Net Income

Net income was US$5.24 million for the first half of 2026, compared with US$5.84 million for the same period of 2025.

Basic and Diluted Earnings per Share

Basic and diluted earnings per share were both US$0.08 for the first half of 2026, compared with US$0.10 for the same period of 2025.

Financial Condition

As of June 30, 2026, the Company had cash and cash equivalents, restricted cash and short-term investments of US$23.16 million, an increase of 24.37% from US$18.62 million as of December 31, 2025.

About ZJK Industrial Co., Ltd.
ZJK Industrial Co., Ltd. is a high-tech precision parts and hardware manufacturer serving artificial intelligence (AI) infrastructure, consumer electronics, electric vehicles, aerospace, and other smart technologies. With over 15 years in the precision metal parts manufacturing industry, the Company maintains a skilled professional team, a series of highly automated and precision manufacturing equipment, a stable and diversified customer base, and comprehensive quality management systems. ZJK mainly offers standard screws, precision screws and nuts, high-strength bolts and nuts, turning parts, stamping parts and Computer Numerical Control (CNC) machining parts, CNC milling parts, high precision structural components, Surface Mounting Technology (SMT) for miniature parts packaging, and technology service for research and development from a professional engineering team. For more information, please visit the Company’s website at https://ir.zjk-industrial.com/.

Forward-Looking Statements
Certain statements in this announcement are forward-looking statements. These forward-looking statements involve known and unknown risks and uncertainties (including, but not limited to, uncertainties of whether contract value of our purchase orders will be fully realized) and are based on the Company’s current expectations and projections about future events that the Company believes may affect its financial condition, results of operations, business strategy and financial needs. Investors can find many (but not all) of these statements by the use of words such as “may,” “will,” “expect,” “anticipate,” “aim,” “estimate,” “intend,” “plan,” “believe,” “likely to,” “propose” or other similar expressions in this announcement. The Company undertakes no obligation to update or revise publicly any forward-looking statements to reflect subsequent events or circumstances, or changes in its expectations, except as may be required by law. Although the Company believes that the expectations expressed in these forward-looking statements are reasonable, it cannot assure you that such expectations will turn out to be correct, and the Company cautions investors that actual results may differ materially from the anticipated results and encourages investors to review other factors that may affect its future results in the Company’s filings with the U.S. Securities and Exchange Commission.

For more information, please contact:
ZJK Industrial Co., Ltd.
Phone: +86-755-28341175
Email: ir@zjk-industrial.com

The Blueshirt Group Asia
Feifei Shen
Phone: +86-134-66566136
Email: feifei@blueshirtgroup.co

ZJK Industrial Co., Ltd.
CONDENSED CONSOLIDATED BALANCE SHEETS
(In U.S. dollars, except for numbers of shares data)
 
    As of
    December
31, 2025
  June
30,
2026
        (Unaudited)
ASSETS                
Current assets                
Cash and cash equivalents     14,350,959       16,543,610  
Restricted cash     2,037,041       4,484,487  
Short-term investments     2,234,078       2,132,706  
Accounts receivable, net     15,974,676       15,644,701  
Accounts receivable-due from a related party     11,227,799       8,498,381  
Inventories, net     12,143,316       14,245,898  
Prepaid expenses and other current assets, net     964,194       4,379,431  
Other receivables-due from related parties     598,467       3,713  
Total current assets     59,530,530       65,932,927  
                 
Non-current assets                
Property, plant and equipment, net     12,271,875       13,098,045  
Intangible assets, net     97,433       144,361  
Operating lease right-of-use assets     3,574,775       3,309,694  
Long-term investment     3,706,080       1,786,703  
Deferred tax assets, net     —       95,926  
Other non-current assets     347,569       630,674  
Total non-current assets     19,997,732       19,065,403  
                 
TOTAL ASSETS     79,528,262       84,998,330  
                 
LIABILITIES AND SHAREHOLDERS’ EQUITY                
Current liabilities                
Accounts payable     18,233,194       15,369,397  
Notes payable     3,803,926       3,781,226  
Income tax payable     3,431,262       3,906,101  
Accrued expenses and other current liabilities     3,583,457       3,650,004  
Other payables-due to related parties     2,322,224       2,659,954  
Operating lease liabilities, current     726,152       726,186  
Total current liabilities     32,100,215       30,092,868  
                 
Non-current liabilities                
Operating lease liabilities, non-current     2,876,209       2,592,046  
Deferred tax liabilities     957,610       658,971  
Total non-current liabilities     3,833,819       3,251,017  
                 
TOTAL LIABILITIES     35,934,034       33,343,885  
                 
Commitments and contingencies (Note 15)                
                 
Shareholders’ equity                
Ordinary share ($0.000016666667 par value, 3,000,000,000 and nil shares authorized, 63,822,249 and nil shares issued and outstanding as of December 31, 2025 and June 30, 2026, respectively*)     1,063       —  
Class A Ordinary shares ($0.000016666667 par value, nil and 2,991,000,000 shares authorized, nil and 55,322,249 shares issued and outstanding as of December 31 and June 30, 2026, respectively**)     —       921  
Class B Ordinary shares ($0.000016666667 par value, nil and 9,000,000 shares authorized, nil and 9,000,000 shares issued and outstanding as of December 31 and June 30, 2026, respectively**)     —       150  
Additional paid-in capital     8,977,814       10,372,982  
Statutory surplus reserves     2,662,115       2,662,115  
Retained earnings     32,132,905       37,378,247  
Accumulated other comprehensive (loss)/income     (304,868 )     1,004,477  
Total ZJK Industrial Co., Ltd. shareholders’ equity     43,469,029       51,418,892  
Non-controlling interests     125,199       235,553  
Total shareholders’ equity     43,594,228       51,654,445  
                 
TOTAL LIABILITIES AND SHAREHOLDERS’ EQUITY     79,528,262       84,998,330  
                 

* The shares and per share information are presented on a retroactive basis to reflect the reorganization completed on March 28, 2023, the two share splits that occurred on June 19, 2023 and June 6, 2024, respectively.

ZJK Industrial Co., Ltd.
UNAUDITED CONDENSED CONSOLIDATED STATEMENTS OF INCOME AND COMPREHENSIVE INCOME
(In U.S. dollars, except for the number of shares data)
 
    For the six months ended June 30,
    2025   2026
    (Unaudited)
Revenues                
Third-party sales     15,153,800       24,389,206  
Related-party sales     9,549,460       9,355,383  
Total revenues     24,703,260       33,744,589  
Cost of revenues                
Third-party sales     (5,653,621 )     (11,837,351 )
Related-party sales     (6,730,162 )     (7,615,072 )
Total cost of revenues     (12,383,783 )     (19,452,423 )
Gross profit     12,319,477       14,292,166  
                 
Operating expenses                
Selling and marketing expenses     (3,555,816 )     (4,243,018 )
General and administrative expenses     (2,690,131 )     (4,112,062 )
Research and development costs     (212,193 )     (280,698 )
Total operating expenses     (6,458,140 )     (8,635,778 )
                 
Income from operations     5,861,337       5,656,388  
                 
Other income, net                
Interest expenses     (6,291 )     —  
Interest income     149,496       166,458  
Share of profits from equity method investment     1,431,032       1,475,335  
Currency exchange gain/(loss)     149,352       (399,575 )
Other income, net     186,949       131,697  
Total other income, net     1,910,538       1,373,915  
                 
Income before income tax provision     7,771,875       7,030,303  
Income tax provision     (1,931,362 )     (1,789,902 )
Net income     5,840,513       5,240,401  
Less: net loss attributable to non-controlling interests     (10,569 )     (4,941 )
Net income attributable to ZJK Industrial Co., Ltd.’s shareholders     5,851,082       5,245,342  
                 
Other comprehensive (loss)/income                
Foreign currency translation adjustment attributable to parent company     559,787       1,309,345  
Foreign currency translation adjustment attributable to non-controlling interests     717       (876 )
Total comprehensive income     6,401,017       6,548,870  
Comprehensive income/(loss) attributable to non-controlling interests     (9,852 )     (5,817 )
Comprehensive income attributable to ZJK Industrial Co., Ltd.’s shareholders     6,410,869       6,554,687  
                 
Earnings per share*                
Basic     0.10       0.08  
Diluted     0.10       0.08  
                 
Weighted average shares used in calculating earnings per share*                
Basic     61,490,641       64,283,575  
Diluted     61,510,641       64,283,575  
                 

 * The shares and per share information are presented on a retroactive basis to reflect the reorganization completed on March 28, 2023 and the two share splits that occurred on June 19, 2023 and June 6, 2024, respectively.

ZJK Industrial Co., Ltd.
UNAUDITED CONDENSED CONSOLIDATED STATEMENTS OF CASH FLOWS
(In U.S. dollars, except for the number of shares data)
 
    For the six months ended June 30,
    2025   2026
    (Unaudited)
Cash flows from operating activities:                
Net income     5,840,513       5,240,401  
Adjustments to reconcile net income to net cash provided by operating activities:                
Reversal for credit loss     (64 )     —  
Depreciation of property, plant and equipment     333,037       725,762  
Amortization of intangible assets     11,769       20,345  
Amortization of operating lease right-of-use assets     213,488       369,495  
Amortization of finance lease right-of-use assets     38,495       —  
Provision for inventories     552,180       438,681  
Share of profits from equity method investment     (1,431,032 )     (1,475,335 )
Provisions/(Benefits) for deferred income tax     131,411       (419,145 )
Share-based compensation     676,625       1,395,176  
Loss on operating lease early termination     —       853  
Changes in operating assets and liabilities:                
Accounts receivable     (1,601,880 )     329,975  
Accounts receivable-due from a related party     1,254,624       2,729,418  
Inventories     (2,620,454 )     (2,541,263 )
Prepaid expenses and other current assets     (274,981 )     (1,672,525 )
Other receivables-due from related parties     (355,145 )     582,305  
Accounts payable     (3,037,042 )     (2,981,256 )
Notes payable     754,083       (22,700 )
Income tax payable     1,150,797       474,839  
Accrued expenses and other current liabilities     681,688       66,547  
Other payables-due to related parties     380,049       322,050  
Operating lease liabilities     (217,245 )     (389,396 )
Net cash provided by operating activities     2,480,916       3,194,227  
                 
Cash flows from investing activities:                
Purchase of property, plant and equipment     (873,418 )     (1,305,650 )
Purchase of intangible assets     (28,410 )     (63,792 )
Net proceeds from short-term investment     288,453       101,372  
Purchase of construction in progress     (483,781 )     (41,464 )
Dividends received from long-term equity investment     1,354,377       1,742,712  
Loans to related parties     (310,510 )     —  
Collection of loans to related parties     179,036       12,449  
Net cash provided by investing activities     125,747       445,627  
                 
Cash flows from financing activities:                
Proceeds from short-term bank borrowings     1,382,017       —  
Repayments of short-term bank borrowings     (1,317,062 )     —  
Contribution from non-controlling shareholders     —       116,171  
Net cash provided by financing activities     64,955       116,171  
                 
Effect of exchange rate changes     211,903       884,072  
                 
Net change in cash, cash equivalents and restricted cash     2,883,521       4,640,097  
                 
Cash, cash equivalents and restricted cash at the beginning of period     13,052,455       16,388,000  
Cash, cash equivalents and restricted cash at the end of period     15,935,976       21,028,097  
                 
The following table provides a reconciliation of cash and cash equivalents and restricted cash reported within the unaudited Condensed Consolidated Balance Sheets that sum to the total of the same amounts shown in the unaudited Condensed Consolidated Statements of Cash Flows:                
Cash and cash equivalents     14,450,968       16,543,610  
Restricted cash     1,485,008       4,484,487  
Total cash and cash equivalents and restricted cash shown in the unaudited Condensed Consolidated Statements of Cash Flows     15,935,976       21,028,097  
                 
Supplemental disclosure of cash flow information:                
Income tax paid     781,335       1,839,031  
Interest expenses paid     6,064       —  
                 
Supplemental disclosures of non-cash activities:                
Obtaining operating right-of-use assets in exchange for operating lease liabilities     —       21,361  
Acquiring property, plant and equipment transferred from construction in progress     284,456       155,923  
Acquiring property, plant and equipment in exchange for accounts payable     719,921       117,459  

Schneider Electric

Schneider Electric cover image
  • Research finds AI in buildings can cut whole-building energy use by up to 22% against traditional controls
  • Annual utility savings of $13,600 to $49,300 per building at current commercial rates, with savings recurring year after year
  • Carbon avoided is more than 100 times the AI system’s own footprint

NEW YORK, Sept. 21, 2026 (GLOBE NEWSWIRE) — Schneider Electric, a global energy technology leader, today published new research at Climate Week NYC 2026 finding that AI-enabled buildings can cut whole-building energy use by up to 22% against traditional controls. The research highlights annual utility savings as $13,600 to $49,300 per building at current commercial rates, helping organizations reduce operating costs every year with the potential to scale across larger portfolios. The research also finds the carbon avoided is more than 100 times greater than the AI system’s footprint.

As concerns grow over AI’s environmental impact, buildings remain one of the world’s largest sources of emissions, accounting for approximately 37% of global energy-related carbon emissions. Schneider Electric’s new research, AI for Climate: Quantifying the Energy and Carbon Impact of Building Optimization, found that AI-driven HVAC optimization deployed through a smart building management system can contribute 7.2-12.7% of additional building energy savings. This shows how AI manages energy more intelligently, easing pressure on building systems and the wider electric grid.

Other key findings include:

  • Up to 60 metric tons of carbon emissions avoided annually per building (59,869kg CO₂e), comparable to the environmental benefit of planting 2,700 mature trees1
  • More than 200 MWh of annual energy savings in some building scenarios, enough electricity to power dozens of average homes for a year
  • AI can more than double the energy savings achieved by smart building controls alone
  • Both cloud and edge AI deployments can deliver significant energy and carbon benefits

“The future of building management will be defined by how effectively organizations connect and contextualize data that was previously trapped in silos. An AI layer on top of existing business systems can turn complexity into intelligence and intelligence into action, reducing emissions, lowering costs and improving performance simultaneously,” said Pankaj Sharma, EVP, Software & Services at Schneider Electric. “As energy demand continues to rise, the ability to deliver these outcomes together, rather than forcing organizations to choose between them, will be critical to achieving both business and sustainability goals.”

The research uses building energy modeling validated against real-world pilot deployments to assess how AI-enabled HVAC control impacts energy consumption, carbon emissions and operating costs across Australia, India and the U.S in differing building scenarios.

The study examined how an AI layer deployed on top of digital building management systems can connect previously siloed data sources, continuously analyze building conditions, and automate HVAC optimization in real time. By incorporating data from occupancy patterns, weather forecasts, equipment performance, and other operational inputs, AI can enable buildings to operate more efficiently while reducing the burden on facility management teams.

The research also found that small and mid-sized buildings (less than 100,000 sqft) stand to benefit significantly from AI-enabled optimization. Historically, energy management systems have been considered too complex or costly for smaller facilities, where dedicated facilities expertise is often limited. By helping automate and simplify optimization, AI can make sophisticated building management more accessible, enabling smaller buildings to reduce energy consumption, lower operating costs and cut emissions.

“AI is putting the power of energy intelligence into the hands of smaller building owners and operators. What once required significant expertise and investment can now be achieved more simply and at greater scale, helping organizations reduce energy waste, lower costs, improve performance, and make smarter decisions with confidence,” added Sharma.

Download the full report: LINK.

Press contact: mediarelations@se.com

About Schneider Electric
Schneider Electric is a global energy technology leader, driving efficiency and sustainability by electrifying, automating, and digitalizing industries, businesses, and homes. Its technologies enable buildings, data centers, factories, infrastructure, and grids to operate as open, interconnected ecosystems, enhancing performance, resilience, and sustainability. The portfolio includes intelligent devices, software-defined architectures, AI-powered systems, digital services, and expert advisory. With 160,000 employees and 1 million partners in over 100 countries, Schneider Electric is consistently ranked among the world’s most sustainable companies. 

www.se.com

Learn more about Advancing Energy Tech on Schneider Electric Insights.

________________________
1 USDA Forest Service (McPherson et al., 1994)

A photo accompanying this announcement is available at https://www.globenewswire.com/NewsRoom/AttachmentNg/70ce2839-2ae2-417e-a7cd-e1fb4ca99cd4

NAPLES, Fla., Sept. 21, 2026 (GLOBE NEWSWIRE) — via IBN — HealthLynked Corp. (OTCQB:HLYK), a healthcare technology company focused on AI-powered patient engagement and care coordination, today announced a strategic enterprise pilot with Palm Beach Accountable Care Organization (PBACO), one of the nation’s leading physician-owned Medicare Shared Savings Program (MSSP) Accountable Care Organizations.

The pilot will evaluate HealthLynked’s AI-powered patient engagement, intelligent scheduling, digital onboarding, care coordination, and virtual healthcare technologies across participating PBACO physician practices. The initiative is designed to determine how artificial intelligence can improve patient access and experience while reducing administrative burden, streamlining physician workflow, and supporting value-based care.

PBACO supports approximately 10,000 physicians and healthcare professionals serving more than 325,000 Medicare beneficiaries across 32 states plus the District of Columbia. PBACO has ranked #1 nationally in Medicare Shared Savings performance in five of the past nine years and maintains an average quality performance score of 93.32%.

AI-Powered Patient Engagement

The pilot will deploy HealthLynked’s patient engagement platform, including the HealthLynked AI Care Agent, AI-powered patient call management, intelligent appointment scheduling, digital patient onboarding, QR-code patient check-in, secure patient communications, provider workflow tools, digital care coordination, and population health engagement capabilities.

The HealthLynked AI Care Agent functions as a digital extension of the physician practice, answering patient calls 24 hours a day, onboarding new patients, securely collecting demographic and insurance information, scheduling and managing appointments, helping patients locate appropriate physicians or specialists, answering common administrative questions, and delivering reminders and follow-up communications.

For patients, the platform is designed to make healthcare easier to navigate by providing 24/7 access to assistance, faster and more convenient scheduling, simplified onboarding and check-in, help identifying the appropriate provider, improved communication with physician practices, and better coordination before and after visits. By reducing friction at each step of the healthcare journey, HealthLynked aims to create a more responsive, connected, and patient-centered experience.

For physicians and their staff, automating routine administrative interactions can reduce repetitive work and allow clinical teams to devote more time to patient care.

Throughout the pilot, PBACO will evaluate key performance indicators including patient engagement, scheduling efficiency, digital onboarding, administrative workload reduction, patient and provider satisfaction, care coordination, and operational efficiencies supporting value-based care.

“Healthcare is rapidly evolving toward intelligent, patient-centered care,” said Dr. Michael Dent, Chairman and Chief Executive Officer of HealthLynked. “Partnering with one of the nation’s premier physician-led Accountable Care Organizations gives us an opportunity to demonstrate how AI can benefit both sides of the healthcare experience—making it easier for patients to access and navigate care while reducing administrative friction for physicians and their teams. Our goal is to create a more connected healthcare experience that improves access, strengthens engagement, and allows providers to spend more time caring for patients.”

“Quality execution is at the heart of value-based care,” said David Klebonis, Chief Operating Officer of Palm Beach Accountable Care Organization. “Our goal is to eliminate unnecessary work and elevate what has the greatest impact on patients. When thoughtfully applied, AI can reduce clicks and administrative burden, surface the right information at the right time, and enable timely interventions that support better outcomes. Ultimately, we want physicians and their teams spending less time managing workflows and more time focused on the patients who need them most.”

Building a Scalable Model for Value-Based Care

HealthLynked and PBACO intend for the pilot to evaluate a scalable model for applying AI, digital patient engagement, and workflow automation within value-based healthcare organizations.

If successful, data generated from the pilot may support broader deployment discussions involving accountable care organizations, commercial insurers, Medicare Advantage organizations, employer-sponsored health plans, clinically integrated networks, physician groups, and other healthcare organizations.

“This pilot provides an opportunity to demonstrate measurable value at the physician-practice level while establishing a model that can potentially scale across much larger healthcare organizations,” added Dr. Dent. “We believe connecting patients, providers, and AI through a unified engagement platform can improve access to care, strengthen care coordination, increase practice efficiency, and help reduce the overall cost of healthcare.”

About Palm Beach Accountable Care Organization

Palm Beach Accountable Care Organization (PBACO) is a physician-owned Medicare Shared Savings Program (MSSP) Accountable Care Organization dedicated to improving healthcare quality, enhancing patient outcomes, and reducing the total cost of care through coordinated, value-based healthcare delivery.

About HealthLynked Corp.

HealthLynked Corp. enhances healthcare through artificial intelligence, personalized care coordination, and innovative patient engagement technologies designed to improve outcomes while reducing healthcare costs. The Company’s cloud-based platform connects patients with providers for virtual or in-office appointments, consolidates medical records into one secure location, and delivers intelligent healthcare navigation designed to simplify access to care.

HealthLynked’s growing suite of AI-powered technologies—including the HealthLynked AI Care Agent, intelligent scheduling, digital care coordination, telemedicine, healthcare navigation, and enterprise software solutions—supports patients, providers, payers, and healthcare organizations in delivering a more connected, efficient, and consumer-centered healthcare experience.

Learn more at www.hlykgroup.com.

Download the HealthLynked App

Apple App Store
Google Play Store

Forward-Looking Statements

This press release contains forward-looking statements as defined by the Private Securities Litigation Reform Act of 1995. Such statements are inherently uncertain and may differ materially from actual results. Forward-looking statements reflect management’s current expectations and are subject to risks, uncertainties, and assumptions. HealthLynked disclaims any obligation to update these statements except as required by law.

Investor & Media Contact

HealthLynked Corp.
Email: IR@healthlynked.com

InvestorWire Service Contact:
IBN
Austin, Texas
www.InvestorBrandNetwork.com
512.354.7000 Office
Editor@InvestorBrandNetwork.com

David Foulkes to retire from Brunswick as Chief Executive Officer and Chairman of the Board at the end of 2026; Aine Denari appointed as Chief Executive Officer effective January 1, 2027; Lead Independent Director, David Everitt will become Non-Executive Chairman

METTAWA, Ill., Sept. 21, 2026 (GLOBE NEWSWIRE) — Brunswick Corporation (NYSE: BC), the global leader in marine manufacturing and technology, today announced that Executive Chairman of the Board of Directors & Chief Executive Officer David Foulkes, will retire from Brunswick at the end of the year.  Aine Denari, currently Executive Vice President and President, Navico Group, and Brunswick Chief Technology Officer has been appointed Chief Executive Officer and will join the Brunswick Board of Directors effective January 1, 2027. David Everitt, currently Brunswick Lead Independent Director, will assume the role of Non-Executive Chairman  also effective January 1, 2027.

“It has been the greatest honor and privilege of my professional life to lead Brunswick Corporation as CEO for the last eight years,” said Foulkes. “With the best leadership team in our industry and the hard work and support of our thousands of committed and talented global employees, we have built the world’s largest and most innovative marine technology company and have outperformed the market and delivered strong shareholder returns through a prolonged period of external turbulence.”

Foulkes has had a distinguished two-decade career at Brunswick, including service as the Company’s Chairman since February 2025 and Chief Executive Officer since January 2019, leading Brunswick through one of the most successful and transformational periods in its history.  Prior to his appointment as Chief Executive Officer, Foulkes served as the Company’s first Chief Technology Officer and ran Brunswick’s Boat Group and financial services businesses, which later became the core of Business Acceleration. His first role with Brunswick was as Vice President of Product Development in the Mercury Marine division, leading the development of the range of outboard, sterndrive, and diesel engines, and advanced controls that now form the core of Mercury Marine’s industry-leading product line-up.

“I am very proud of the exceptional organization we have built, the rich culture we have cultivated, and the leadership position we have earned across the recreational marine industry,” said Foulkes. “With the support of my colleagues, I have achieved much of what I set out to do as Brunswick CEO. I am especially grateful to the Senior Management Team, whose individual and collective leadership I consider exceptional and among the strongest in any industry. I also want to thank my family, especially my wife Gillian, whose unwavering support made my professional achievements possible.”

Foulkes continued, “One of the most important duties of the CEO is to work with the Board to prepare a successor. I believe the time is right for a transition, and I am extremely confident that Aine is the right person to lead Brunswick on the next stage of its journey.  Aine’s broad skill set as a business and technology leader, her strong commitment to Brunswick’s employees and partners, her deep understanding of the marine industry and her ability to deliver financial results will position Brunswick for continued success. I look forward to working with Aine to ensure the smoothest possible transition.”

Denari is a seasoned leader with over 30 years of experience across automotive, mobility, industrial and manufacturing businesses. In 2024, as part of Brunswick’s robust talent development and rotation process, Denari moved into a dual role as President of Navico Group and Brunswick Chief Technology Officer, further broadening her marine, technology, and enterprise leadership experience. In these roles, she helped drive Navico Group market share gains, strong financial performance, and new product innovation from brands such as Lowrance and Simrad including AutoCaptain, the market’s first fully integrated autonomous boat docking solution. She joined Brunswick in 2020 as Executive Vice President and President of Brunswick Boat Group, leading the business through dynamic market conditions while launching new and award-winning boat models and brands and delivering strong financial results. Denari also serves as a director of Masco Corporation. Her experience spans multiple industries, geographies, and customer channels, and she is well positioned to build on Brunswick’s legacy of advanced technology, product leadership, and continuous improvement. 

Denari brings deep engineering expertise and business leadership experience, supported by advanced degrees in engineering and business as well as executive education from several globally recognized institutions, including Stanford, Northwestern, Purdue, the University of Detroit Mercy, and University College Dublin.

“I am thrilled to be appointed CEO of Brunswick Corporation, an exceptional company with a proud legacy, and I look forward to building on its strong foundation,” said Denari. “I thank Dave and the Board for their confidence and trust, and I am committed to a seamless transition. As we move forward, we will continue to execute the strategy outlined at our 2026 Investor Day and build on our strong momentum to deliver transformational growth. I deeply believe in our Next Never Rests culture of continuous improvement and am excited to help lead the next generation of innovative, technology-enabled solutions that make boating easier and more enjoyable. We will continue to strengthen our industry-leading portfolio of marine products while advancing our position as a technology leader in the marine industry. I look forward to working with our Board and leadership team to support and develop our award-winning global workforce of 14,500 employees, while continuing to create long-term value for our shareholders and all stakeholders”

Everitt commented, “This leadership transition is the culmination of the Board’s robust and thoughtful succession planning process leveraging the Company’s talent development work. On behalf of the entire Board, our employees, customers, and shareholders, I thank Dave for his remarkable service and his commitment to ready the next generation of Brunswick leaders and maintain an award-winning culture. We are confident Aine is the ideal next CEO for Brunswick, and we are excited to work with her as she leads the Company forward to deliver its next phase of growth and success.”

About Brunswick Corporation:

Brunswick Corporation (NYSE: BC) is a global leader in marine recreation, delivering innovation that transforms experiences on the water and beyond. Its technology-driven solutions are informed by deep consumer insights and guided by the belief that “Next Never Rests™.” Brunswick is home to more than 60 industry-leading brands across marine propulsion (including Mercury Marine), parts and accessories (including Attwood), and marine electronics (including Simrad and Lowrance), as well as boat brands including Boston Whaler, Sea Ray, Bayliner, Lund, and Harris. Headquartered in Mettawa, Illinois, Brunswick has approximately 14,500 employees operating in 26 countries. Learn more at Brunswick.com.

Forward-Looking Statements

Certain statements in this news release are forward-looking statements as defined in the Private Securities Litigation Reform Act of 1995. Forward-looking statements are based on current expectations, estimates, and projections about Brunswick’s business and by their nature address matters that are, to different degrees, uncertain. Words such as “may,” “could,” “should,” “will,” “expect,” “anticipate,” “project,” “position,” “intend,” “target,” “plan,” “seek,” “estimate,” “believe,” “predict,” “outlook,” and similar expressions are intended to identify forward-looking statements. Forward-looking statements are not guarantees of future performance and involve certain risks and uncertainties that may cause actual results to differ materially from expectations as of the date of this news release. These risks include, but are not limited to: the effect of adverse general economic conditions, including rising interest rates, and the amount of disposable income consumers have available for discretionary spending; changes to trade policy and tariffs, including retaliatory tariffs; fiscal and monetary policy changes; adverse capital market conditions; changes in currency exchange rates; competitive pricing pressures; higher energy and fuel costs; managing our manufacturing footprint and operations; loss of key customers; international business risks, geopolitical tensions or conflicts, sanctions, embargoes, or other regulations; actual or anticipated increases in costs, disruptions of supply, or defects in raw materials, parts, or components we purchase from third parties; supplier manufacturing constraints, increased demand for shipping carriers, and transportation disruptions; adverse weather conditions, climate change events and other catastrophic event risks; our ability to develop new and innovative products and services at a competitive price; absorbing fixed costs in production; our ability to meet demand in a rapidly changing environment; public health emergencies or pandemics; our ability to successfully implement our strategic plan and growth initiatives; attracting and retaining skilled labor, implementing succession plans for key leadership and executing organizational and leadership changes; our ability to integrate acquisitions and the risk for associated disruption to our business; the risk that restructuring or strategic divestitures will not provide business benefits; our ability to identify and complete targeted acquisitions; maintaining effective distribution; dealer and customer ability to access adequate financing; inventory reductions by dealers, retailers, or independent boat builders; requirements for us to repurchase inventory; risks related to the Freedom Boat Club franchise business model; outages, breaches, or other cybersecurity events regarding our technology systems, which have affected and could further affect manufacturing and business operations and could result in lost or stolen information and associated remediation costs; our ability to protect our brands and intellectual property; an impairment to the value of goodwill and other assets; product liability, warranty, and other claims risks; legal, environmental, and other regulatory compliance, including increased costs, fines, and reputational risks; risks associated with joint ventures that do not operate solely for our benefit; changes in income tax legislation or enforcement; managing our share repurchases; and risks associated with certain divisive shareholder activist actions.

Additional risk factors are included in the Company’s Annual Report on Form 10-K for 2025 and in subsequent Quarterly Reports on Form 10-Q. Forward-looking statements speak only as of the date on which they are made, and Brunswick does not undertake any obligation to update them to reflect events or circumstances after the date of this news release.

CONTACT: Lee
Gordon —
Chief Communications Officer
M: (904) 860-8848 | O: (847) 735-4003

Privacy Overview

This website uses cookies so that we can provide you with the best user experience possible. Cookie information is stored in your browser and performs functions such as recognising you when you return to our website and helping our team to understand which sections of the website you find most interesting and useful.